


Container Schedule Reliability Slumps to 56.4% as Port Congestion Spreads

Global liner schedule reliability fell sharply to 56.4% in July, its lowest level since February 2025, while the average delay for late vessels climbed to 6.06 days. With more than 4.3 million TEU of containership capacity now waiting to berth worldwide, port congestion is increasingly translating into lost vessel productivity across the global liner network.
Global container shipping’s fragile recovery in schedule performance reversed sharply in July, as worsening port congestion and network disruption pushed reliability to its lowest level of 2026.
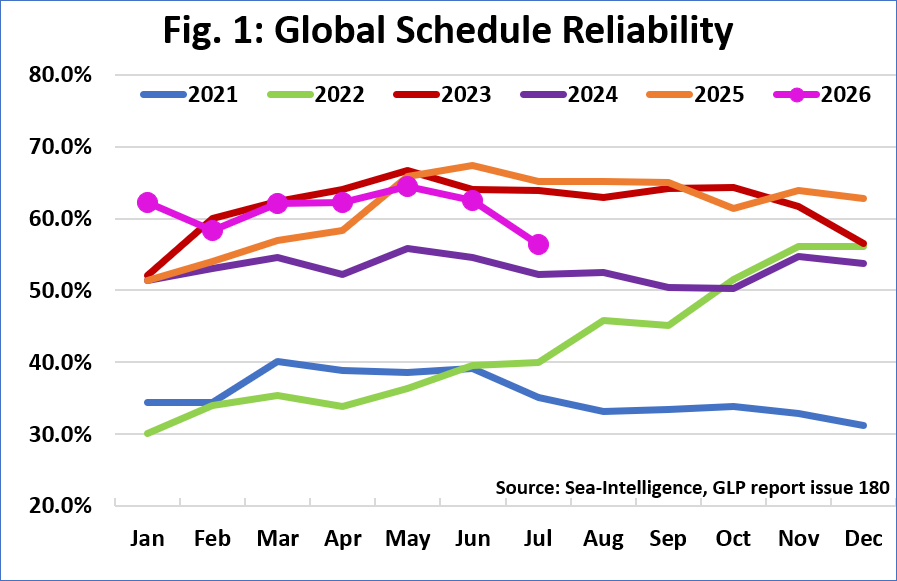
Sea-Intelligence’s Global Liner Performance Issue 180 showed that global schedule reliability fell by 6.1 percentage points month on month to 56.4% in July, the weakest reading since February 2025. Reliability was also 8.8 percentage points below the level recorded a year earlier.
The deterioration was not limited to the number of vessels arriving late. Average delays for late vessel arrivals increased by 0.59 days from June to 6.06 days, the highest level since January 2024 and 1.34 days longer than a year earlier. Sea-Intelligence’s full Global Liner Performance report covers more than 60 carriers across 34 trade lanes.
The figures suggest that the industry’s congestion problem is moving beyond queues outside individual ports. Longer voyage cycles, port omissions, transshipment changes and schedule-recovery measures are increasingly reducing the amount of capacity that can actually be deployed as planned.
Two Months Erase Much of the Earlier Improvement
Global schedule reliability had been improving earlier in the year.
Sea-Intelligence’s May 2026 Global Liner Performance update showed reliability reaching 64.7% in May, the highest level of the year at that point, after a 2.5-percentage-point monthly improvement. Average delays for late vessels stood at 5.52 days.
By June, reliability had slipped to 62.6%, although the average delay improved slightly to 5.31 days, according to Global Liner Performance Issue 179. July then brought a much sharper deterioration.
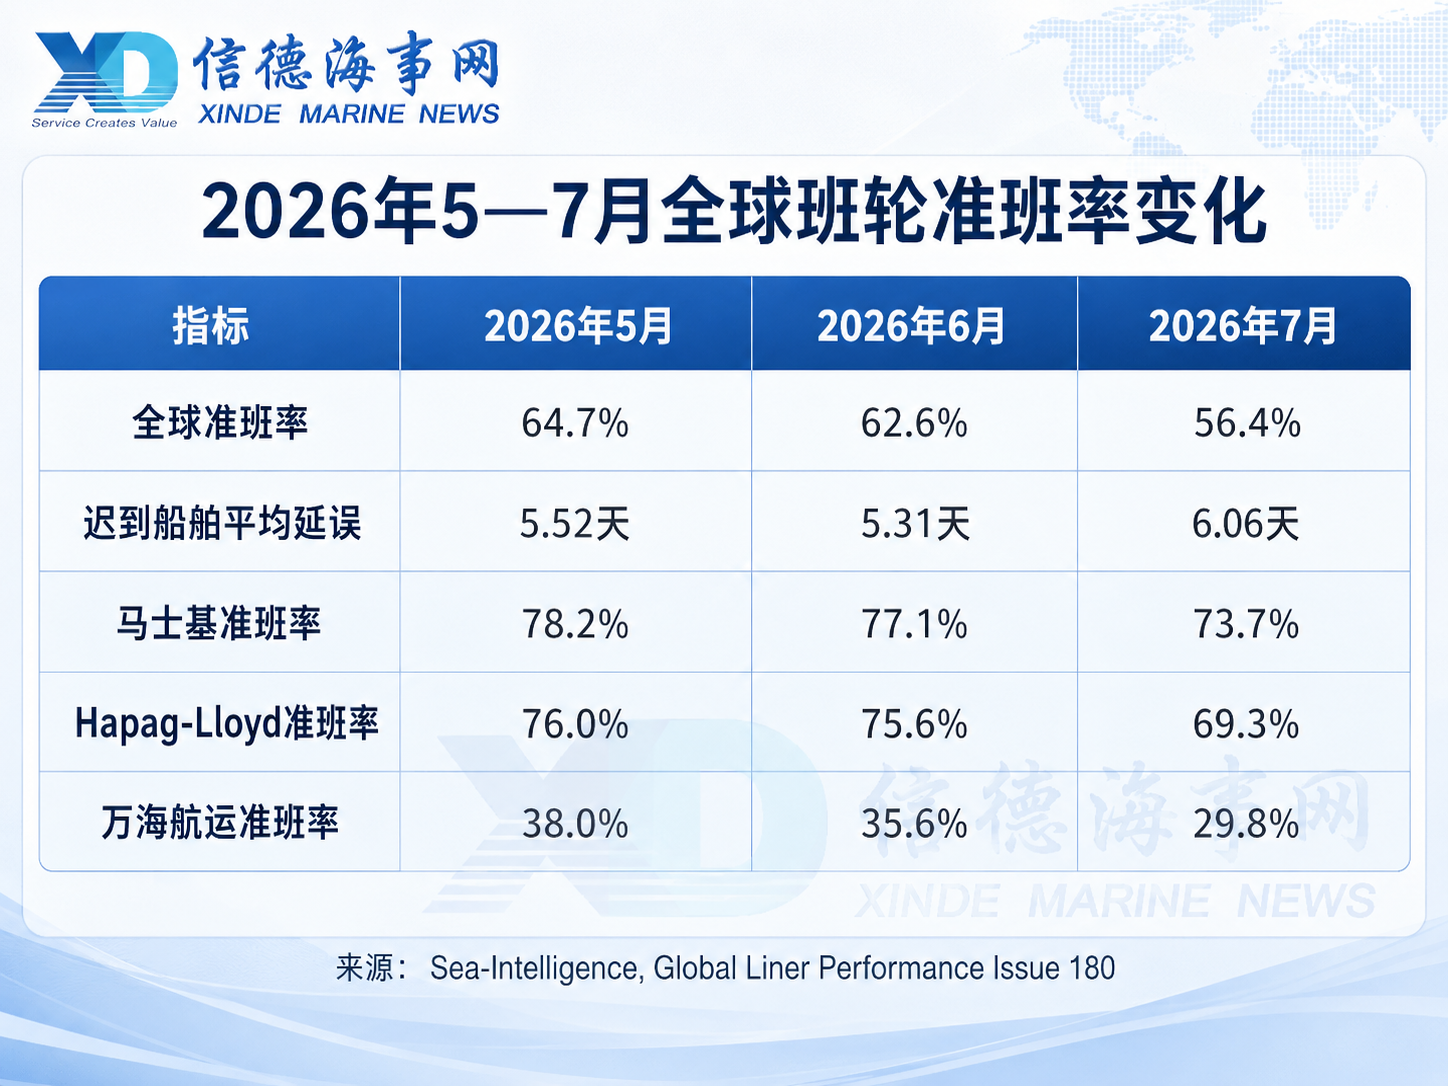
Source: Sea-Intelligence, Global Liner Performance Issues 178, 179 and 180.
The deterioration was broad-based. None of the 13 largest carriers monitored by Sea-Intelligence recorded a month-on-month improvement in July. MSC posted the largest monthly fall, at 11.9 percentage points. On a year-on-year basis, all 13 carriers were also worse, with Wan Hai showing the steepest decline at 24.4 percentage points.
A separate dataset points in the same direction.
Kuehne+Nagel’s seaexplorer Schedule Reliability Report for July 2026 put global reliability at 51.9%, down from 56.6% in June. Sixteen of the 18 trade lanes it monitored deteriorated month on month, with Asia–North Europe and Asia–Mediterranean/Black Sea among the weakest-performing major Asian trades.
The absolute figures differ because the providers use different datasets and methodologies, so they should not be compared directly. But both show the same underlying trend: liner networks suffered a substantial deterioration in July.
More Than 4.3 Million TEU Is Waiting to Berth
The weaker schedule data has coincided with a further escalation in port congestion.
Linerlytica’s Market Pulse 2026 Week 34 reported on August 25 that more than 4.3 million TEU of containership capacity was waiting to berth globally, exceeding the roughly 4.0 million TEU absolute peak recorded during the pandemic congestion of 2022.
That comparison, however, requires an important qualification.
The global containership fleet has expanded significantly since 2022. Linerlytica estimates the current fleet at about 34.4 million TEU, meaning the stranded capacity represents 12.6% of the fleet. At the 2022 peak, around 4.0 million TEU represented 15.7% of a much smaller 25.3-million-TEU fleet.
In other words, today’s congestion has surpassed the pandemic-era peak in absolute TEU terms, but it has not yet surpassed it as a proportion of the global fleet.
That distinction matters. The current disruption is severe enough to materially affect vessel productivity, but it is not yet equivalent to the relative capacity shock seen at the height of the pandemic.
China Port Delays Are Feeding Into Global Schedules
East Asia is one of the main pressure points.
Hapag-Lloyd’s Week 35 Asia & Oceania Operational Update, published on August 26, reported increased waiting times at Chinese ports following terminal congestion and the impact of typhoons BAVI, DOLPHIN and SAUDEL.
At Shanghai’s Yangshan terminals, Hapag-Lloyd reported average waiting times of five to seven days for Gemini vessels longer than 366 metres, and eight to 10 days for smaller Gemini ships. Non-Gemini services were facing waits of seven to 11 days.
At Ningbo, waiting times were around four to five days for Gemini services and three to six days for non-Gemini services. The carrier also warned that Shanghai and Ningbo could face closures or operational interruptions between August 26 and 29 because of Typhoon SAUDEL.
More significant than the waiting times themselves is what carriers are doing to recover their networks.
Hapag-Lloyd’s operational update lists numerous port omissions, rotation changes, vessel replacements and transshipment arrangements affecting services through Shanghai, Ningbo and Yantian. Cargo originally intended for one Chinese gateway is in some cases being discharged or connected via ports such as Singapore, Busan or Hong Kong.
These measures can help a vessel recover its schedule, but they do not necessarily mean the cargo itself has recovered.
Skipping a delayed port may improve the vessel’s subsequent punctuality while forcing export boxes at the omitted port to wait for another sailing. Import cargo discharged for onward transshipment may also face additional connection risks.
This is why congestion at Shanghai or Ningbo does not remain a purely Chinese port problem. China is one of the world’s largest container export origins and sits at the heart of the major Asia–Europe and transpacific trades. Delays at its biggest gateways can propagate through hub ports, connecting services and destination terminals thousands of miles away.
1.7 Million TEU Effectively Absorbed by Delays
The more revealing measure may not be how much tonnage is waiting outside ports, but how much fleet capacity is being consumed by longer voyage cycles.
Sea-Intelligence estimated on August 19 that 5.0% of global deep-sea container capacity is currently tied up by persistent delays, equivalent to about 1.7 million TEU. Its analysis is available in “1.7 million TEU vessel space absorbed in delays”.
During the relatively stable 2011–2019 period, an average of only 2.2% of global capacity was absorbed by delays.
The current market is therefore losing an additional 2.8 percentage points of effective capacity compared with the pre-pandemic norm. On today’s fleet, Sea-Intelligence calculates that this represents roughly 1.0 million TEU of additional capacity loss beyond the historical baseline.
The same analysis provides useful historical context. During 2011–2019, global schedule reliability typically ran at around 70% to 80%, while late ships were usually delayed by three to four days. Current reliability is well below that range, while delays have become substantially longer.
The 4.3 million TEU congestion figure and the 1.7 million TEU capacity-loss figure should not be added together.
Linerlytica’s figure measures the capacity of vessels waiting to berth at a given point in time. Sea-Intelligence’s estimate measures the effective deep-sea capacity absorbed by the frequency and duration of delays. The methodologies are different and the underlying vessels overlap.
But both datasets point to the same commercial problem: nominal fleet capacity is not the same as usable fleet capacity.
If a round voyage that should take 70 days instead takes 75 days because of port waiting, rerouting and schedule recovery, a carrier needs more ships to maintain the same weekly frequency. If extra tonnage is unavailable, it must accept longer intervals, blank sailings, port omissions or service adjustments.
That is how congestion becomes a form of hidden capacity loss.
Maersk at 73.7%, Wan Hai at 29.8%
The sharp divergence between carriers in July also highlights how differently liner networks can absorb the same external disruption.
Maersk ranked first among the 13 major carriers monitored by Sea-Intelligence, with schedule reliability of 73.7%, and was the only carrier above 70%. Its Gemini Cooperation partner Hapag-Lloyd ranked second at 69.3%.
At the other end of the table, Taiwan-based Wan Hai Lines recorded just 29.8%.
The gap should not be read simply as a league table of operational quality. Carriers have very different trade exposures, port portfolios, vessel sizes, regional networks and transshipment structures.
But the results do suggest that network design can become more important when the external operating environment deteriorates.
The Gemini Cooperation between Maersk and Hapag-Lloyd was explicitly designed around fewer mainline port calls and a larger role for dedicated shuttle services. Maersk says its 29 mainline services have, on average, almost half as many port calls per rotation as a typical Asia–Europe service, while 28 intra-regional shuttles connect hubs with strategic gateways. Its stated target is schedule reliability of more than 90% once the network is fully phased in.
The model is intended to reduce the number of opportunities for delays at individual ports to contaminate an entire long-haul rotation.
Earlier data suggest Gemini has performed strongly on that measure. Sea-Intelligence reported that during the May/June measurement period, Gemini achieved 93.4% alliance schedule reliability, compared with 80.7% for MSC, 67.6% for Ocean Alliance and 53.6% for Premier Alliance.
Still, those alliance-level figures should not be used to directly explain the July gap between Maersk and Wan Hai. They relate to a different measurement period and different network portfolios.
The more defensible conclusion is that when port and weather disruption intensifies, differences that may be less visible in stable conditions — including network architecture, hub dependency, schedule buffers and the ability to deploy recovery tonnage — become much more significant.
A Structural Capacity Shortage? Too Early to Say
July’s 56.4% reliability reading is strong evidence that the liner network is again losing efficiency.
It is not yet sufficient evidence that container shipping has entered a permanent structural capacity shortage.
Part of the current congestion in China has been intensified by successive typhoons, meaning at least some of the disruption could unwind relatively quickly once weather conditions improve and vessel queues are cleared.
At the same time, the global fleet is considerably larger than during the pandemic. The fact that today’s 4.3 million TEU of stranded capacity represents 12.6% of the fleet — below the 15.7% peak in 2022 — is an important reminder that headline congestion numbers must be judged against overall fleet growth.
What matters now is the duration of the disruption.
If congestion at major Asian gateways eases quickly, schedule reliability could recover and a significant part of the lost productivity could return to the market.
If port waiting, route diversions and network recovery measures remain persistent, however, the impact of continuing newbuilding deliveries could be partly offset by slower fleet turnover.
That would have direct implications for three markets: containership charter demand, effective slot availability on major east-west trades, and the ability of freight rates to remain supported after the traditional peak season fades.
The most important number, therefore, may not be July’s 56.4% reliability rate.
The bigger question is how much of the global containership fleet can actually complete voyages according to schedule.
The next signals to watch will be the pace at which congestion clears at Shanghai and Ningbo, whether global schedule reliability stabilises in August, and whether Sea-Intelligence’s 5% capacity absorption rate begins to fall.
Those indicators will help determine whether the current schedule crisis is primarily a weather- and congestion-driven shock — or the beginning of a more persistent constraint on effective global container capacity.


READ MORE
 Ports & Terminals
Ningbo Port’s September Box Volumes Rebound 9.3%
 Ports & Terminals
Germany Blocks COSCO’s Zippel Deal, Testing Inland Logistics Expansion
 Ports & Terminals
Keep buying!Inside the Maersk Family’s Infrastructure Buying Spree——From 70-Plus Ships to 50-Plus Terminals
 Ports & Terminals
Vietnam’s Cai Mep Terminals Open 1,200-Metre Shared Berth
 Ports & Terminals
US Fees on Chinese-Built Ships May Be Delayed Until January, Pending USTR Action
 Ports & Terminals
COSCO SHIPPING and Shanghai Post Launch 28-Day Postal Sea Route to Peru via Chancay
 Ports & Terminals
Pinglu Canal opens a new river-to-sea route for southwest China
 Ports & Terminals
China’s $10.7bn Pinglu Canal to Open Sept. 16, Cutting Southwest–ASEAN Shipping Route by 560 km
 Ports & Terminals
Northern Europe Port Strikes Add New Pressure to Asia–Europe Container Schedules
 Ports & Terminals