


$862,150 a Day: VLCC Rates Set Another Record as Global Composite Nears $500,000
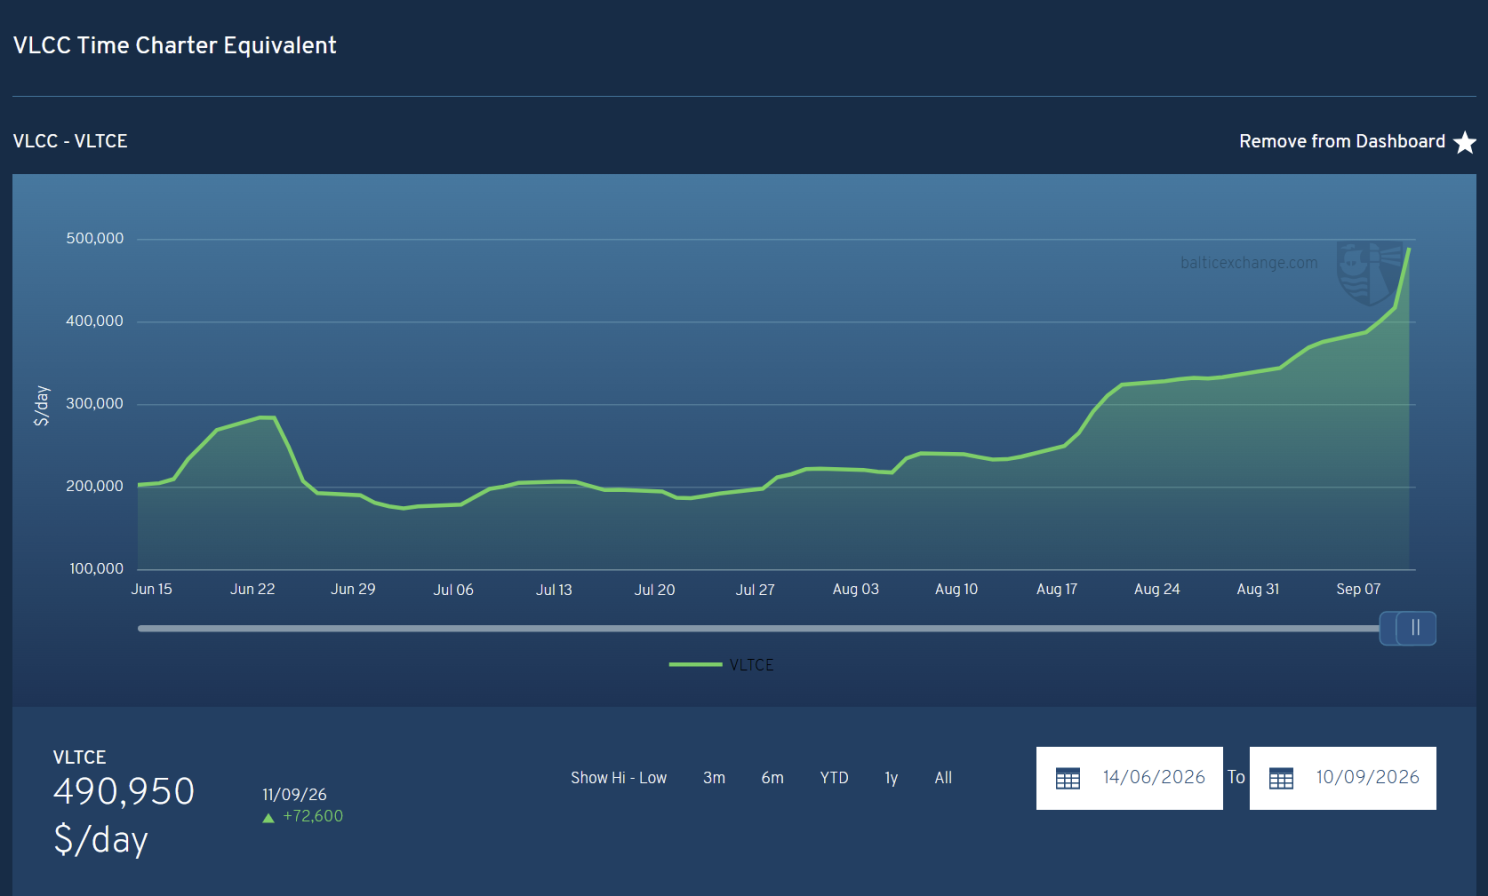

The Middle East Gulf–China TD3C benchmark has climbed to $862,150 per day, while the Baltic Exchange’s composite VLCC TCE has reached $490,950 per day. Simultaneous gains on the West Africa–China, US Gulf–China and Gulf of Oman–China routes show that the Hormuz crisis is spreading through vessel deployment, crude-trade diversion and declining fleet efficiency, triggering a broader repricing of effective VLCC supply.
The VLCC market has set another record.
Baltic Exchange data for September 10 showed the benchmark TD3C route for 270,000 tonnes of crude from the Middle East Gulf to China rising to WS821.11, equivalent to a time charter equivalent, or TCE, of $862,150 per day. That was an increase of $75,997 per day from the previous session. After reaching $759,969 per day on September 8, TD3C added another 13.4% in just two trading days, lifting its theoretical daily return by more than $100,000.
The Baltic VLCC TCE, or VLTCE, offers a broader measure of market conditions. It jumped from $418,350 per day on September 9 to $490,950 per day on September 10, a one-day increase of $72,600, or 17.35%. The composite rose 42.2% from $345,206 per day on September 1 and has gained almost 180% from its recent low of $175,349 per day on July 2.
These figures require careful interpretation. VLTCE is a composite benchmark calculated from several representative VLCC routes; it is not the actual average net income earned by every VLCC in the world. The $862,150-per-day TD3C assessment is likewise a theoretical TCE based on standardised voyage assumptions, rather than evidence that every fixture is being concluded at that level. Actual voyage returns will depend on additional war-risk premiums, crew compensation, waiting time, deviations, bunker consumption, charter-party terms and the allocation of extraordinary costs between owner and charterer.
As indicators of marginal spot-market pricing, however, the two figures send an unmistakable signal. Exceptional earnings are no longer confined to a single route exposed directly to the Strait of Hormuz. The world’s principal VLCC trades are simultaneously attaching a much higher value to vessel time, geographical position, operational certainty and the capacity to accept risk.
From a TD3C record to a synchronised global rally
The September 10 movement was strikingly broad. The West Africa–China TD15 TCE surged from $257,163 to $353,642 per day, adding $96,479 in a single session, or 37.5%. The Gulf of Oman–China TD34 assessment rose from $385,779 to $465,764 per day, an increase of $79,985. The US Gulf–China TD22 route advanced from $211,733 to $257,059 per day, adding $45,326.

Across the two sessions from September 8 to September 10, TD3C increased by 13.4%, TD34 by 30.0% and TD22 by 22.2%. TD15 recorded the largest gain, rising 49.1% from $237,259 to $353,642 per day. The VLTCE composite gained 22.0% over the same period.
The scale of the TD15 increase changes the interpretation of the rally. A voyage from West Africa to China does not pass through Hormuz, while the US Gulf–China trade is geographically far removed from the Middle East Gulf. Direct exposure to the strait can therefore explain only part of the wider market movement. The regional security crisis is being transmitted through the global VLCC deployment system: Middle East Gulf charterers must pay more to attract vessels, while Atlantic Basin cargoes must offer higher returns to prevent locally positioned ships from ballasting east. At the same time, rising Asian purchases of West African and American crude are absorbing ships that might otherwise have repositioned towards the Middle East.
VLCCs do not operate as closed fleets permanently assigned to individual routes. A vessel open near West Africa, Brazil or the US Gulf can remain in the Atlantic Basin for its next cargo or reposition towards the Middle East. A ship completing discharge in China may return to the Middle East Gulf, head towards West Africa or wait for employment in Asia. Owners compare the return, duration, risk and end-position of each option across an entire voyage cycle, rather than looking only at the headline freight attached to one cargo.
Once the potential return on a Middle East Gulf voyage exceeds $800,000 per day, it raises the opportunity cost of employing a VLCC elsewhere. Charterers in West Africa and the Americas must increase their offers to retain vessels that could otherwise move east. The simultaneous rise in TD15, TD22 and TD34 suggests that TD3C has begun to function as an anchor for marginal VLCC pricing across multiple basins.
The physical fleet remains in place, but effective supply is thinning rapidly
The current market presents an apparent contradiction. The number of VLCCs at sea has not suddenly fallen, and the observable ballast fleet in some regions has actually expanded. Freight rates have nevertheless climbed at an exceptional speed.
Vortexa data showed that mainstream VLCC tonne-mile demand weakened during August, while the global ballast VLCC fleet increased by about 25% from its July low. By the end of August, the number of laden and ballast units in the mainstream fleet had each reached roughly 350–360 vessels. East of Hormuz, the number of waiting VLCCs increased from single digits in early July to about 40 by the end of August, the highest level since early 2025. In purely physical terms, there is no obvious absence of ships around the Gulf of Oman.
A VLCC appearing on a vessel-positioning map does not automatically constitute tonnage that a charterer can employ immediately. It must first fit the required laycan and location, pass age, technical, sanctions-compliance and vetting requirements, and secure agreement from the owner, insurer and crew to perform the voyage. Even when those conditions are met, uncertainty remains over whether the vessel can transit the strait, berth and load on schedule, and complete the voyage within a commercially acceptable period.
The present market therefore requires a distinction between physical supply and effective supply. Physical supply consists of registered, operational vessels. Effective supply consists of ships that can obtain insurance, satisfy all counterparties, enter the nominated loading area at an acceptable level of risk and complete the voyage within the required window. Effective supply is the intersection of position, eligibility, willingness, insurability and time. Tightening in any one of those areas can remove a physically available ship from the competitive list.
The substantial freight differential that emerged between Ras Tanura–Ningbo and Mina Al Fahal–Ningbo, with the latter loading outside Hormuz, illustrates this fragmentation. The difference in sailing distance could not account for a several-fold gap in freight. The market was pricing the risk, waiting time and unpredictability attached to entering the Middle East Gulf. Conflict has divided a fleet that would ordinarily be largely interchangeable into smaller pools with very different risk tolerances.
Under these conditions, the effective supply curve becomes extremely steep. When the number of owners willing to consider a cargo within a particular laycan falls from more than a dozen to only a few, one additional requirement can force charterers to raise bids sharply. The final vessel prepared to accept the voyage becomes the marginal price-setter for the route, allowing TCE assessments to move by tens of thousands of dollars—and, in the case of TD15, almost $100,000—in a single day.
Why limited and intermittent passage can sustain extreme freight rates
Conditions in the Strait of Hormuz are more complex than a simple choice between normal operations and complete closure.
Reuters, citing Kpler data, reported that only seven publicly visible commercial cargo vessels transited Hormuz on September 9: four outbound and three inbound. They included the laden VLCC FINLAND PROSPERITY, carrying close to 2 million barrels of crude, but no LNG carrier was publicly observed leaving the Gulf. As some vessels may have switched off their automatic identification systems, the figure cannot be treated as a complete count of all traffic. It nevertheless indicates that visible commercial flows remained abnormally low.
A total closure would rapidly suppress loadings and eventually reduce demand for VLCC transportation. Limited and unpredictable passage creates a different freight dynamic: it preserves part of the cargo flow while making the time and risk cost of every voyage difficult to estimate. Crude still needs to be exported, refineries still need feedstock and charterers still need vessels, but owners cannot know with confidence how long a ship may wait, whether transit conditions will change, how far insurance costs could rise or whether the vessel can preserve its subsequent trading schedule.
Owners incorporate that uncertainty into their minimum acceptable rate. The freight quotation must cover more than bunkers, port charges and an ordinary voyage duration. It also compensates for tail risk, potential loss of the next employment opportunity and the possibility that the vessel will be tied up in the region for an extended period. Charterers are paying both for transport and for an owner’s commitment to make commercially usable capacity available under highly uncertain conditions.
Some Middle East Gulf export volumes are meanwhile recovering. Market data cited by Breakwave indicated that Basrah crude exports increased from around 1.35 million barrels per day in July to about 2.35 million barrels per day in August. The combination of more cargo and a shrinking pool of ships prepared to call in the Gulf is highly conducive to sudden rate jumps. Transport requirements are rising faster than the number of vessels able to execute them with sufficient certainty.
The TD15 surge reveals the second-round impact of trade diversion
The Hormuz crisis has reduced the number of owners willing to enter the Middle East Gulf and has also begun to alter the crude-purchasing decisions of Asian refiners. The latter development is pushing VLCC tightness into the Atlantic Basin.
Reuters reported that Chinese independent refiners had recently purchased more than 20 million barrels of West African, Canadian and South American crude as Middle Eastern supply became less reliable and some sanctioned barrels grew scarcer. Market participants expected China’s seaborne crude imports to recover from roughly 7 million barrels per day in July to between 8.5 million and 9 million barrels per day.
Import volume determines only one part of tanker demand. The origin of the crude and the time required for a vessel to complete its full trading cycle are equally important. Chinese purchases from West Africa, Brazil and the US Gulf generally occupy a VLCC for longer and leave it with a more complex repositioning decision after discharge. Each long-haul cargo adds tonne-miles and delays the vessel’s return to the open market.
A reinforcing chain is taking shape. Risk in the Middle East Gulf drives TD3C higher; Asian buyers increase Atlantic Basin purchases; West African and American cargoes absorb local VLCCs and reduce the flow of ballast vessels back towards the Middle East; Gulf charterers must offer still higher freight to attract tonnage; and stronger Middle Eastern returns lift owners’ expectations in other regions.
This mechanism helps account for TD15 recording a larger two-day increase than TD3C. TD3C reflects the initial security shock, while TD15 captures the second-round effects of crude substitution, longer voyages and inter-basin competition for vessels. A regional security crisis is being converted into a reconfiguration of global VLCC positioning.
S&P Global had already identified a rapid tightening of the Atlantic Basin position list. On September 4, the lump-sum rate for a US Gulf–China VLCC voyage reached a record $29.5 million, while the availability of ships for early and mid-October cargoes was reported to be exceptionally limited. As TD15 and TD22 continue to rise, Atlantic cargoes are competing directly with Middle Eastern employment for the same marginal vessels.
Waiting, STS transfers and a reorganised supply chain are consuming vessel time
Shipping supply is ultimately the product of fleet size and fleet productivity. Every day that a VLCC waits outside a strait removes one vessel-day from the market. When dozens of ships remain idle or operationally constrained, the accumulated loss of effective capacity can alter the balance between cargoes and vessels across an entire region.
Since the disruption at Hormuz, some crude movements have shifted towards shuttle voyages, strait transits and ship-to-ship transfers in the Gulf of Oman. Such arrangements can keep oil moving, but they add berthing, waiting, matching and transfer requirements. A continuous voyage ordinarily performed by one VLCC may be divided into several transport legs involving more ships, with greater exposure to weather, port windows and schedule mismatches.
This helps reconcile a further apparent contradiction: VLCC tonne-mile demand did not increase in step with freight during August, yet the transport system consumed more vessel time. Shuttle voyages produce relatively few tonne-miles but still occupy ships. STS operations preserve cargo flows but require two vessels to meet in the same place at the same time. Waiting generates no transport output while postponing a ship’s return to the next round of employment.
An assessment of VLCC supply must consequently examine how many effective voyages the fleet can complete, rather than simply counting open ships. Longer waits, fragmented routes, delayed laycans and positional mismatches all reduce annual voyage productivity. Even with an unchanged physical fleet, the market’s available deadweight-tonne days can contract rapidly.
The roughly 40 VLCCs reported waiting around the Gulf of Oman therefore do not necessarily represent an immediate wall of supply capable of pushing rates lower. As long as those vessels cannot enter the Middle East Gulf, secure cargoes or complete STS operations within predictable windows, much of that capacity remains temporarily frozen. The speed at which it returns to competitive employment will be a key determinant of both the duration of the rally and the severity of any eventual correction.
Bab el-Mandeb is weakening the redundancy of the Middle East export system
As Hormuz traffic has been disrupted, Saudi Arabia’s East–West crude pipeline and the Red Sea port of Yanbu have assumed a larger role in diverting exports. Reuters, citing different vessel-tracking providers, reported a sharp increase in crude and condensate loadings at Yanbu in early September. Vortexa estimated that volumes rose from about 3.2 million barrels per day in August to roughly 3.7 million barrels per day, while Kpler’s different methodology indicated an increase from around 1.5 million to 2.9 million barrels per day.
Yanbu gives Middle Eastern producers additional capacity to bypass Hormuz, but it also directs more oil into the Red Sea. Asia-bound cargoes generally still need to transit Bab el-Mandeb, while European flows involve the Suez Canal and related pipeline infrastructure. The Houthi takeover of Mocha has intensified security concerns close to Bab el-Mandeb, raising the prospect that the network being used to relieve pressure on Hormuz may itself face higher insurance costs and greater transit uncertainty.
The Red Sea risk has not yet generated a standalone freight premium comparable with TD3C. Its immediate effect is to reduce confidence in the reliability of alternative routes. If the Middle East export system loses part of its remaining flexibility, Asian refiners may have to draw still more crude from the Atlantic Basin, lengthening voyages and complicating vessel deployment. Owners will also demand additional compensation as they weigh safety and future positioning across the Red Sea, Hormuz and Cape routes.
Brent crude briefly climbed to around $109.97 per barrel, indicating that the wider energy market was simultaneously assessing supply disruption and maritime chokepoint risk. For VLCC shipping, the threats at Hormuz and Bab el-Mandeb are interconnected. Together they influence where Middle Eastern crude can be exported, where Asian buyers must seek replacement barrels and how long each tanker remains committed to a transport cycle.
What a $490,950 VLTCE means for owners, charterers and asset values
For owners with substantial VLCC spot exposure, a VLTCE of $490,950 per day implies extraordinary cash-flow potential, although benchmark TCEs must be separated from final voyage profits. The allocation of additional war-risk insurance, crew bonuses and security costs, as well as whether waiting time is covered by demurrage, can materially change the net return. Owners with ships fixed on period charters or committed under fixed-rate contracts of affreightment will not necessarily capture the full upside in the spot market.
Charterers and refiners face the corresponding increase in costs. A VLCC typically carrying around 2 million barrels can incur tens of millions of dollars in additional voyage freight, directly increasing the delivered cost per barrel and changing the relative economics of crude from different origins. When refiners switch from Middle Eastern to West African or American barrels, they must compare crude quality, purchase price, voyage duration, freight and delivery timing. Diversion shifts part of the supply risk into higher transport costs and longer inventory cycles.
Exceptional spot rates may also feed into VLCC period rates, secondhand values and shipping-equity expectations. Asset prices, however, depend far more on duration than on a single record assessment. An $862,150-per-day benchmark can transform the economics of one voyage, but it cannot by itself determine the value of a ship over the next decade. A more durable revaluation would require intermittent passage, longer-distance crude procurement and the fragmentation of effective supply to persist long enough to reshape forward earnings expectations.
Three conditions will determine when the rally reverses
The marginal price in today’s VLCC market is being set by a small number of ships available for immediate employment. That makes the market capable of rising extremely quickly—and of falling just as abruptly if security and operational conditions improve. Three groups of indicators will be central to judging the rally’s durability.
The first is the effective restoration of commercial traffic through Hormuz: visible ship movements, the number of VLCCs entering and leaving the Gulf, insurance pricing and owners’ willingness to accept Middle East Gulf cargoes. A brief rise in transit numbers will not by itself establish normalisation. Waiting ships will return to effective supply only when owners can again estimate voyage duration, cost and security conditions with reasonable confidence.
The second is the waiting fleet in the Gulf of Oman and the wider global position list. The roughly 40 waiting VLCCs represent potential supply. If risk subsides and a large share of them re-enters competition at the same time, the number of candidates for Gulf cargoes could increase rapidly, pulling marginal rates lower. If they remain constrained, decline Gulf employment or continue to be absorbed by STS and shuttle work, the physical availability of those ships will do little to relieve the market.
The third is the crude-purchasing pattern of China and other Asian importers. Continued growth in West African, Brazilian and US Gulf cargoes would lengthen voyages and absorb Atlantic Basin capacity. A stable recovery in Middle Eastern supply and transportation could shorten some trading distances and return more VLCCs to the available fleet sooner. Security at Bab el-Mandeb, Red Sea export volumes and the utilisation of alternative pipelines will also shape that adjustment.
Newbuilding deliveries remain relevant over the medium term, but additional ships cannot immediately resolve the market’s current fragmentation by risk. The scarce unit is the vessel-day that can be committed safely, compliantly and with sufficient certainty to a particular cargo window. A larger physical fleet helps only when insurance, crews, route access and operational productivity allow those ships to enter the trades where capacity is needed.
The $862,150-per-day TD3C assessment captures the extreme marginal price of a voyage exposed to Hormuz. The $490,950-per-day VLTCE shows that the shock has moved beyond the Middle East Gulf and into the principal VLCC markets of West Africa, the Americas and the Gulf of Oman.
The global VLCC fleet has not physically disappeared. Security risk, trade diversion, waiting and transport-chain reorganisation are nevertheless reducing the number of commercially usable ships and the vessel-days they can deliver. Freight is now pricing capacity, time, transit certainty and the willingness to accept risk—and all four have become dramatically more expensive.


READ MORE
 Tankers
VLCC Benchmark Tops $1 Million a Day: How Are Owners Using the Windfall?
 Tankers
An $81 Million Quote for One Voyage: How Long Can the Tanker Market Frenzy Last?
 Tankers
From Dubai Property to Tankers: TOP Ships Signs Four-Ship GSI Deal
 Tankers
A 15-Year-Old VLCC Sells for $161 Million as Tanker Asset Prices Surge
 Tankers
Two Voyages Pay for a New VLCC?
 Tankers
4 Delivered, 4 More Ordered: Schoeller Returns to Chengxi for MR Tankers
 Tankers
Tianjin Southwest Maritime Chairman Liu Jichun Targets Asphalt Tanker Owner Xin Yuan
 Tankers
US Sanctions 17 Ships in Iran Crackdown, Naming China-Linked Owners
 Tankers
PIF Energy Plans $2 Billion VLCC Fleet for Gulf Crude Trade
 Tankers