


Too Many Ships? Maersk’s $1.31bn Quarter Tells a Different Story
Supply Is Growing Faster Than Demand — So Why Did Maersk Still Make $1.31 Billion in Q2?
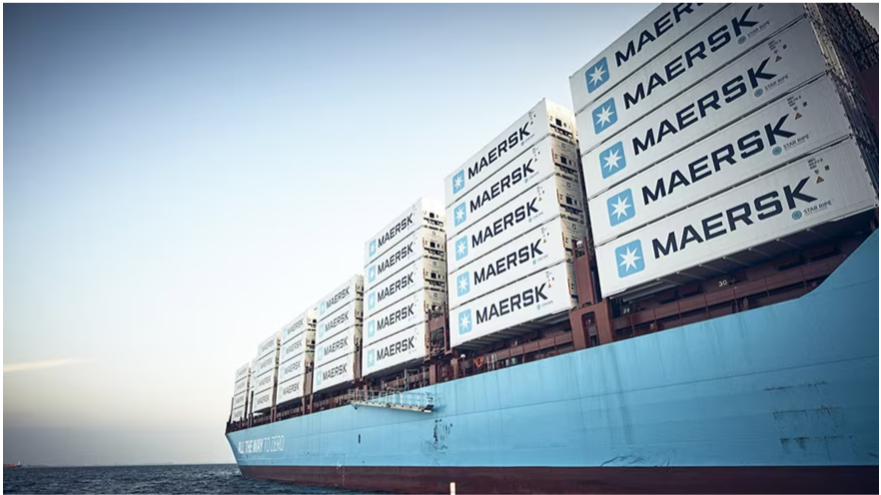

Maersk generated $28.73 billion in revenue in the first half of 2026, up 8.6% year on year, but EBITDA, EBIT and net profit all remained below the levels recorded a year earlier. The real change came in the second quarter, when net profit surged to $1.31 billion, accounting for roughly 93% of the group’s first-half earnings. Ocean EBIT swung from a $192 million loss in the first quarter to a $935 million profit in Q2. Behind that sharp turnaround lies a broader market signal: nominal container shipping capacity continues to expand faster than demand, yet congestion, trade imbalances, route disruptions and geopolitical risks are absorbing effective capacity and keeping freight rates elevated.
A.P. Moller - Maersk’s 2026 financial year is developing into a story of a remarkably sharp earnings reversal.
On 13 August, Maersk reported its second-quarter and first-half results. Revenue for the first six months of 2026 reached $28.73 billion, up 8.6% from $26.45 billion a year earlier. EBITDA declined 5.3% to $4.75 billion, while EBIT fell 8.9% to $1.91 billion. Net profit dropped 23.5% to $1.41 billion, and the group’s EBIT margin narrowed from 7.9% to 6.7%.

On a half-year basis, therefore, Maersk has not yet returned to the profitability levels seen in the first half of 2025. Revenue has resumed growth, but earnings and cash flow have remained under pressure. Cash flow from operating activities fell from $4.63 billion to $3.29 billion, while free cash flow moved from a positive $433 million a year ago to a negative $325 million. Cash conversion also weakened from 92% to 69%.
The six-month figures, however, conceal a dramatic change between the first and second quarters.
In Q2, Maersk generated revenue of $15.76 billion, up 20% year on year. EBITDA rose 30% to $2.99 billion, while EBIT jumped 86% to $1.57 billion. Net profit more than doubled from $639 million to $1.31 billion, taking the quarterly EBIT margin to 10.0%.
One figure captures the scale of the turnaround particularly well. Of Maersk’s $1.41 billion net profit in the first half, $1.31 billion was earned in the second quarter alone. In other words, Q2 accounted for approximately 93% of the group’s first-half net profit.
The improvement was therefore not gradual. Maersk entered the year under significant pressure, but earnings accelerated sharply as the second quarter progressed. That change also explains why the group has raised its full-year financial guidance twice within just a few months.
Q2 Marks a Clear Earnings Inflection Point
All three of Maersk’s main business segments increased revenue during the first half. Ocean revenue rose by approximately $1.2 billion year on year, Logistics & Services added $859 million, and Terminals increased revenue by $224 million. Together, they pushed consolidated group revenue higher by more than $2.2 billion.
Profitability recovered more slowly. Group EBITDA fell by $263 million in the first half, with Ocean accounting for a $402 million decline. Group EBIT also fell by $187 million, again largely because of weaker Ocean earnings during the earlier part of the year.
The operating environment in the first quarter remained difficult. Freight rates were still relatively weak, while higher fuel prices, port congestion and network disruptions pushed costs higher. Growing trade imbalances also required more repositioning of empty containers and more complicated network management, adding further operational friction.
That combination began to change in the second quarter. Strong Asian export demand continued to support cargo volumes, spot freight rates rose sharply and vessel utilisation remained high. Revenue growth from higher rates increasingly outweighed the rise in operating costs. Q2 free cash flow also returned to a positive $549 million, compared with a negative $373 million in the same period last year.
The first half is therefore best understood as two very different operating phases. Q1 remained constrained by lower freight rates and higher costs, while Q2 saw a rapid release of operating leverage as rates strengthened.
Ocean: From a $192 Million Loss to a $935 Million Profit in One Quarter
Ocean remains the business that determines the direction of Maersk’s consolidated earnings.
During the first half of 2026, Ocean generated revenue of $18.70 billion, up around 7% year on year. Loaded volumes increased 6.5%, while average freight rates were 3.5% higher.
Profitability, however, remained below last year’s level. Ocean EBITDA declined 12% from $3.35 billion to $2.94 billion, while EBIT fell 24% from $972 million to $743 million. The EBIT margin narrowed from 5.6% to 4.0%.
The main reason was cost inflation. Ocean operating costs reached $15.55 billion in the first half, around 10% higher year on year. Fuel costs increased 9.9%, container handling costs rose 11%, and network costs excluding fuel increased 9.6%. Port congestion, additional storage charges and continued network adjustments all contributed to the higher cost base.
The picture changed dramatically in Q2.
Ocean revenue reached $10.53 billion, up 23% year on year. EBITDA increased 41% to $2.04 billion, while EBIT surged from $229 million to $935 million. Loaded volumes reached 3.361 million FFE, 4.1% higher than a year earlier, while the average loaded freight rate climbed 21.6% to $2,746 per FFE. Compared with the first quarter, the average freight rate increased by roughly 32%. Vessel utilisation reached 96%.
This created one of the most striking quarter-on-quarter reversals in recent container shipping earnings. Ocean EBIT moved from a $192 million loss in Q1 to a $935 million profit in Q2, an improvement of more than $1.1 billion in just three months.
Freight rates were the most direct driver, but they were not the only factor. Maersk’s average fuel price increased 44% year on year in Q2 to $777 per tonne of fuel oil equivalent, lifting fuel costs by 36%. Even so, the company reduced fuel consumption by 4.3% and improved fuel efficiency by 5.9%. On a fixed-energy-price basis, unit costs still fell by 0.8%.
The Gemini Cooperation is also beginning to contribute to the cost base. Maersk said the cost benefits realised from Gemini were slightly above the upper end of the previously expected range. At the same time, the group’s volume growth outpaced growth in its own deployed fleet capacity by around two percentage points. With vessel utilisation already at 96%, stronger volumes and higher rates translated into a much larger uplift in earnings.
This is a classic feature of liner shipping economics. Once utilisation is already high, additional freight-rate revenue can flow rapidly into profit, meaning earnings can move far more sharply than cargo volumes themselves.
Lower Depreciation Also Boosted EBIT
One accounting change also needs to be separated from the underlying operating improvement.
From 1 January 2026, Maersk extended the estimated useful life of its vessels from 20 years to 25 years. The change reduced depreciation expenses by approximately $175 million in Q2 and by $351 million in the first half.
The change has no impact on EBITDA, but it directly improves EBIT and net profit by reducing depreciation charges. Ocean EBIT increased by $706 million year on year in Q2, from $229 million to $935 million, and roughly $175 million of that improvement came from lower depreciation.
That does not undermine the operating turnaround. Even excluding the accounting effect, Ocean’s Q2 performance improved materially, as shown by the 41% rise in EBITDA, the 21.6% increase in freight rates and continued cargo growth. But the accounting change is important when comparing EBIT with previous periods.
Logistics & Services Continues to Improve
Unlike the pronounced cyclicality in Ocean, Maersk’s Logistics & Services business continues to show a steadier improvement in profitability.
In the first half, logistics revenue rose to $8.02 billion from $7.16 billion a year earlier. EBITDA increased from $802 million to $901 million, while EBIT rose 23% from $317 million to $390 million. The EBIT margin improved from 4.4% to 4.9%.
Momentum strengthened further in Q2. Revenue reached $4.22 billion, up 15% year on year, while EBITDA came in at $468 million and EBIT increased 24% to $217 million. The EBIT margin rose to 5.1%. This marked the ninth consecutive quarter in which Logistics & Services delivered a year-on-year improvement in EBIT margin.
Maersk has further divided the segment into Forwarding, Solutions and Landside. Forwarding revenue increased 32% in Q2 to $839 million, driven by stronger airfreight and project logistics volumes. Solutions revenue rose 11% to approximately $1.23 billion, while Landside revenue increased 14% to $2.30 billion.
Profitability varied across those activities. Forwarding posted an EBIT margin of 6.4%, slightly below 6.8% a year earlier. The Solutions margin declined from 3.8% to 1.7%, while Landside improved from 5.1% to 6.3%, making it one of the clearest bright spots within the logistics division.
Disruption around the Strait of Hormuz also provided a practical illustration of Maersk’s integrated logistics strategy. Cargo originally destined to move through Gulf ports was diverted to alternative gateways and subsequently transported via landbridge solutions. Maersk said around 44,000 of approximately 47,000 affected containers ultimately reached their destinations.
The episode shows how the group can use landside transport, warehousing, forwarding, customs and multimodal logistics to redesign cargo flows when ocean routes are disrupted. What raises costs and complexity for Ocean can simultaneously create new demand for Landside and other logistics services.
Years of investment in an integrated “ocean plus logistics” model are increasingly producing tangible operating synergies.
Terminals Remains One of the Group’s Most Stable Profit Contributors
Terminals continued to deliver strong and relatively stable earnings.
Revenue reached $2.76 billion in the first half, up 8.8% year on year. EBITDA increased to $1.01 billion from $902 million, while EBIT rose to $894 million from $855 million.
In Q2, revenue increased 11% to $1.45 billion and EBITDA rose 13% to $517 million, reaching a new quarterly high. EBIT was broadly stable at $458 million compared with $461 million a year earlier.
Throughput increased by only 2.2%, but revenue per move rose by 7.1%, or 7.7% on a like-for-like basis. Higher tariffs and stronger storage revenue were among the main contributors.
This illustrates the different economics of Ocean and Terminals under the same market conditions. Port congestion means longer waiting times, lower network efficiency and higher costs for liner operators, while terminal operators can sometimes benefit from higher storage revenue and additional service income.
Because Maersk owns both a global liner network and major terminal assets, some of the economic impact of supply-chain disruption can effectively be redistributed across different parts of the group.
Maersk Has Raised Guidance Twice in Just Over Three Months
The strength of the second quarter prompted Maersk to lift its 2026 full-year outlook once again.
The group now expects underlying EBITDA of $10.5 billion to $12.5 billion, up from the $8.0 billion to $10.0 billion range announced in late June. Underlying EBIT is now expected at $4.5 billion to $6.5 billion, compared with the previous range of $2.0 billion to $4.0 billion. Free cash flow is now expected to be above zero, versus the earlier guidance of at least negative $1.5 billion.
The scale of the revision becomes clearer when compared with Maersk’s outlook in May.
At the time of its Q1 results, the company expected underlying EBITDA of just $4.5 billion to $7.0 billion and underlying EBIT ranging from a $1.5 billion loss to a $1.0 billion profit. Free cash flow was expected to be no worse than negative $3.0 billion.
By late June, after demand from the Far East remained stronger than expected and spot freight rates continued to rise, Maersk raised its guidance for the first time, lifting EBITDA to $8.0 billion to $10.0 billion and EBIT to $2.0 billion to $4.0 billion.
Following the Q2 results, those ranges have now been lifted again to $10.5 billion to $12.5 billion and $4.5 billion to $6.5 billion respectively.
From May to August, the lower end of Maersk’s EBITDA guidance has therefore risen from $4.5 billion to $10.5 billion, an increase of $6.0 billion. The upper end has moved from $7.0 billion to $12.5 billion. The change in EBIT expectations is even more striking: a scenario that once allowed for a $1.5 billion operating loss now assumes at least $4.5 billion of underlying EBIT.
The revisions highlight just how quickly conditions in the container shipping market have changed during 2026.
Fleet Capacity Is Up 5.4%, Demand Only 3%-4% — Yet Freight Rates Are Rising
The most important message in Maersk’s half-year report for the broader container shipping market may not be its own earnings at all.
It is the apparent contradiction between supply growth and freight rates.
Maersk estimates that global container trade demand increased by around 3%-4% year on year in the second quarter. Global nominal container fleet capacity, however, grew by 5.4%. Newbuildings continued to enter the market, while containership scrapping remained close to zero for a sixth consecutive quarter.
Under a simple supply-and-demand framework, fleet growth running ahead of demand should place sustained downward pressure on freight rates.
The market moved in the opposite direction.
Average SCFI spot rates increased by around 55% quarter on quarter in Q2 and by roughly 42% compared with the same period last year. Maersk’s own average loaded freight rate increased 21.6% year on year, helping push Ocean from a loss in Q1 to a substantial profit in Q2.
This suggests that the traditional calculation of “fleet growth minus demand growth” is increasingly insufficient to explain the container market.
Nominal fleet capacity is not the same as effective capacity.
Disruption in the Strait of Hormuz, continued rerouting on selected services, port congestion, longer vessel waiting times, widening trade imbalances, empty-container repositioning and network redesign can all reduce the amount of cargo a vessel is able to carry over a given period.
Maersk itself described the current environment as reflecting a “structural shift in Ocean market dynamics”. It highlighted three forces acting simultaneously: continued growth in global container demand, widening imbalances between head-haul and back-haul trades, and under-investment in port and landside infrastructure over the past 10 to 15 years.
Cargo volumes can rise and fleets can expand, but if ports, yards, railways, roads and inland transport networks cannot increase throughput efficiency at the same pace, not all of the additional nominal capacity translates into usable transportation capacity.
That distinction is becoming increasingly important in the 2026 container market.
China Remains a Major Engine of Container Trade Growth
Maersk’s regional demand data also helps explain where growth is coming from.
Middle East container imports fell by around 40% year on year in Q2 as regional disruptions affected trade flows. That decline was offset by stronger demand elsewhere. Imports into Africa increased by around 13%, Latin America by 7.0% and North America by 5.8%.
Maersk specifically noted that Far East exports, particularly exports from China, were once again the main engine of global container trade growth and said that strength could continue into the third quarter.
The consequence is not simply more cargo. It is also greater trade imbalance.
Large volumes are moving from Asia into North America, Europe, Africa and Latin America, while back-haul volumes are not increasing at the same pace. That requires more empty-container repositioning and more complex vessel deployment.
The greater the imbalance, the less efficiently the same global fleet can be used. This is another reason why looking only at the number of TEU entering the fleet provides an incomplete picture of actual market supply.
Freight Rates Remain Maersk’s Most Powerful Earnings Variable
Maersk also updated the sensitivity of its earnings to several key market factors.
All else being equal, a $100 per FFE change in average container freight rates could affect full-year EBIT by approximately $700 million.
The figure again illustrates the operating leverage embedded in liner shipping.
With Maersk’s vessel utilisation already at 96% in Q2, much of the additional revenue generated by higher rates can flow rapidly through to earnings. That is why a roughly 32% quarter-on-quarter increase in average freight rates helped move Ocean EBIT from a $192 million loss in Q1 to a $935 million profit in Q2.
It also explains why Maersk’s annual earnings guidance can move by several billion dollars within only a few months.
Relatively modest changes in average freight rates, when applied across tens of millions of FFE transported annually, can materially reshape the earnings profile of a global liner operator.
A Return to the Red Sea Could Become a Major Supply-Side Variable
Some of the forces currently supporting freight rates may not be permanent.
Maersk said in its Q2 investor material that it had begun a gradual return to selected Red Sea services, with the first related AE15 service announced on 6 July, after the end of the second quarter.
A broader return of Asia-Europe services through the Red Sea and Suez Canal could have significant implications for effective capacity. Shorter sailing distances would improve vessel turnaround times, allowing the same fleet to complete more voyages and releasing capacity currently absorbed by longer diversions.
At the same time, the global nominal fleet continues to expand, new vessels continue to be delivered and scrapping remains exceptionally low. If Red Sea normalisation releases substantial effective capacity at the same time as newbuilding deliveries continue, spot rates could face renewed downward pressure.
In the other direction, disruption around the Strait of Hormuz and broader Middle East risks continue to absorb capacity through port diversions, landbridge solutions, network adjustments and congestion.
The container market is therefore being pulled by two opposing forces. Newbuilding deliveries and a potential return to the Red Sea are increasing effective supply, while geopolitical disruption, trade imbalances and infrastructure bottlenecks continue to reduce network efficiency.
Which of those forces changes faster over the coming quarters may matter more for freight rates than the headline growth rate of the global fleet itself.
A New Supply-Demand Logic Is Emerging
Maersk’s first-half numbers do not point to across-the-board earnings growth. Revenue increased 8.6%, but EBITDA fell 5.3%, EBIT declined 8.9%, net profit dropped 23.5%, and first-half free cash flow remained negative.
The second quarter, however, marked a clear operating inflection. Group net profit more than doubled year on year and accounted for around 93% of first-half earnings. Ocean moved from a $192 million loss in Q1 to a $935 million profit in Q2. Logistics margins improved for a ninth consecutive quarter, while Terminals remained highly profitable. Maersk has also raised its full-year outlook twice in just over three months.
The broader message goes beyond Maersk itself.
Global containership capacity continues to grow faster than cargo demand. Newbuilding orders remain large and scrapping is minimal. Conventional analysis would suggest that these factors should weigh heavily on freight rates.
Yet the second quarter of 2026 shows that the gap between nominal capacity and effective capacity is becoming increasingly important.
Trade imbalances require more empty-container repositioning. Congestion slows vessel turnaround. Geopolitical disruption lengthens voyages and forces network redesign. Under-investment in landside infrastructure further reduces the efficiency of the entire transport chain.
That helps explain a phenomenon that has repeatedly emerged in recent years: the world may have plenty of ships on paper, but the market can still suddenly feel short of capacity.
Maersk’s Q2 earnings reversal is one of the clearest financial expressions of that dynamic.
In 2026, assessing the container shipping balance is no longer only about how many TEU are being added to the global fleet. Where the cargo originates, where it is going, how far vessels need to sail, how long they wait in port, how much empty equipment must be repositioned and whether critical routes such as the Red Sea and the Strait of Hormuz remain fully accessible are increasingly determining how much capacity is actually available to the market.
That may be the most important message contained in Maersk’s latest half-year report.


READ MORE
 Finance
Xiamen C&D plans RMB 500 million ship investment
 Finance
China Guohang Ocean’s H1 Profit Jumps to 4.47 Times Its Full-Year 2025 Earnings
 Finance
Seaspan Raises RMB 1.5 Billion in China as Panda Bond Market Opens to Global Shipping
 Finance
16 LNG Carriers for 12 Tankers and $300 Million: How K-LNG Could Reshape Asia’s Gas Shipping Market
 Finance
Yangzijiang Shipbuilding Posts Record H1 Profit of RMB 5.37bn as Shipbuilding Margin Rises to 37.1%
 Finance
Pacific Basin’s H1 Profit Surges 310%, Already Exceeding Full-Year 2025 Earnings
 Finance
MOL Raises Full-Year Net Profit Forecast by 41% as Shipping Markets Outperform
 Finance
Who Is Making the Most Money in China’s Shipbuilding Supercycle?
 Finance
Record Cruise Fares and Higher Earnings Guidance Lift Royal Caribbean and Rival Stocks
 Finance