



Global container shipping has entered the second half of 2026 with a market structure that is proving far more resilient — and far more fragmented — than many had expected.
On paper, the ingredients for softer freight rates were already in place by mid-year. The global containership fleet had expanded beyond 34 million teu, newbuilding deliveries were continuing, part of the tariff-driven front-loading seen in the second quarter was beginning to fade, and the US import cycle was moving beyond the strongest phase of the traditional peak season. At the same time, more carriers were cautiously testing a return to the Red Sea and Suez Canal.
Earlier market assessments based on the Ningbo Containerized Freight Index and other Chinese shipping data had already pointed to increasing pressure on freight rates in the second half of the year. Maritime Strategies International, or MSI, reached a similar conclusion in August: absent another major disruption, spot container rates were likely close to the peak of the current cycle, while the larger wave of supply pressure from the orderbook would become more pronounced from 2027 onwards.
Yet by early September, the market had not followed a simple downward trajectory.
On 4 September, the Shanghai Containerized Freight Index, or SCFI, stood at 3,590.05 points, up 80.52 points from 3,509.53 a week earlier, representing a weekly increase of around 2.3%. The China Containerized Freight Index, or CCFI, was also marginally higher at 1,837.01 points.

The headline indices, however, conceal increasingly divergent conditions across individual trades.
European rates were under clear pressure. The CCFI Europe index fell 4.9% in the week, while the Mediterranean index dropped 5.0%. At the same time, the US West Coast index rose 5.0%, the US East Coast increased 1.1%, Southeast Asia gained 4.0%, South America 6.0%, and the Persian Gulf/Red Sea trade 4.6%.
Drewry’s World Container Index showed almost exactly the same pattern. Its composite index was broadly unchanged at $4,465 per 40-foot container on 3 September, but the underlying routes moved sharply in opposite directions. Shanghai–Los Angeles rose 5% to $7,185 per feu and Shanghai–New York gained 3% to $9,587 per feu. Shanghai–Rotterdam, by contrast, fell 5% to $4,092 per feu, while Shanghai–Genoa dropped 10% to $4,368 per feu.

The result is a container market that is no longer moving in one direction.
The broad-based rally seen earlier this year is giving way to a period in which freight rates are increasingly being set by the conditions of individual trades: cargo volumes, deployed capacity, blank sailings, congestion, network disruption and geopolitical risk.
The fleet continues to grow, but effective capacity remains constrained. Some major routes are already feeling downward pressure, while others remain supported by stronger cargo flows and more aggressive capacity management.
That distinction may define the remainder of 2026.
More ships are entering the fleet — so why has the market not loosened?
Supply growth remains one of the central themes of the container market.
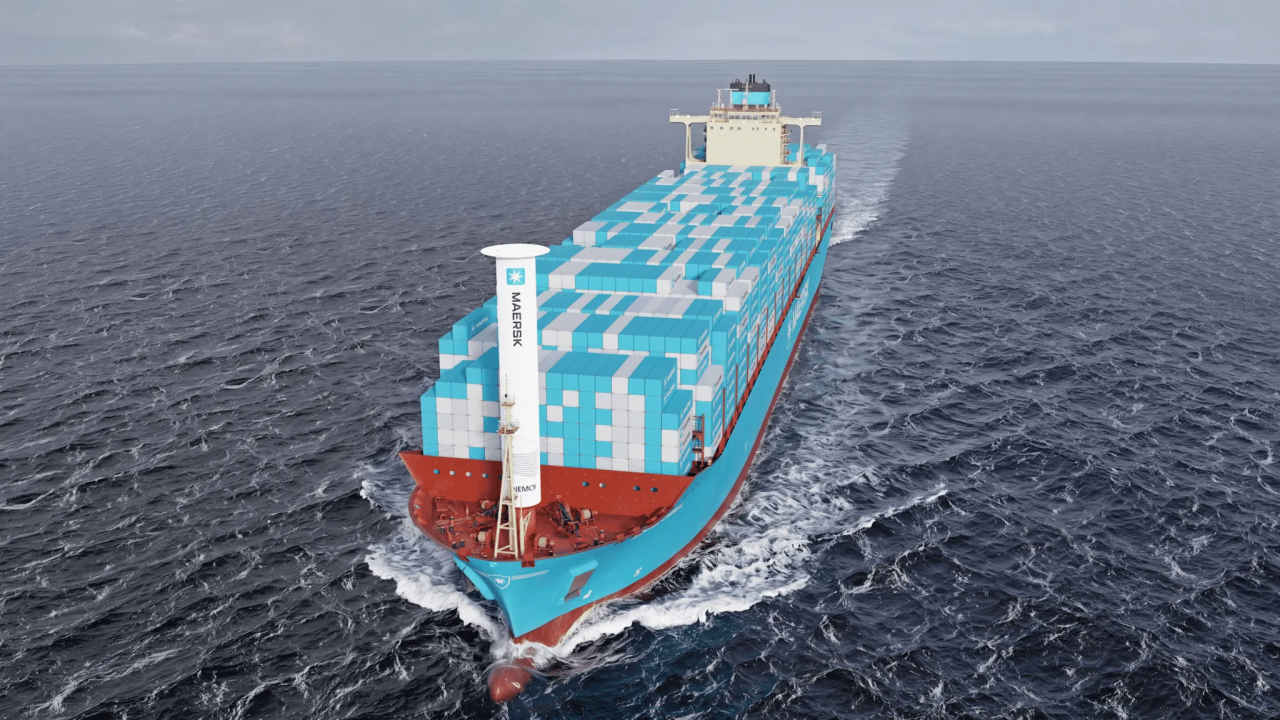
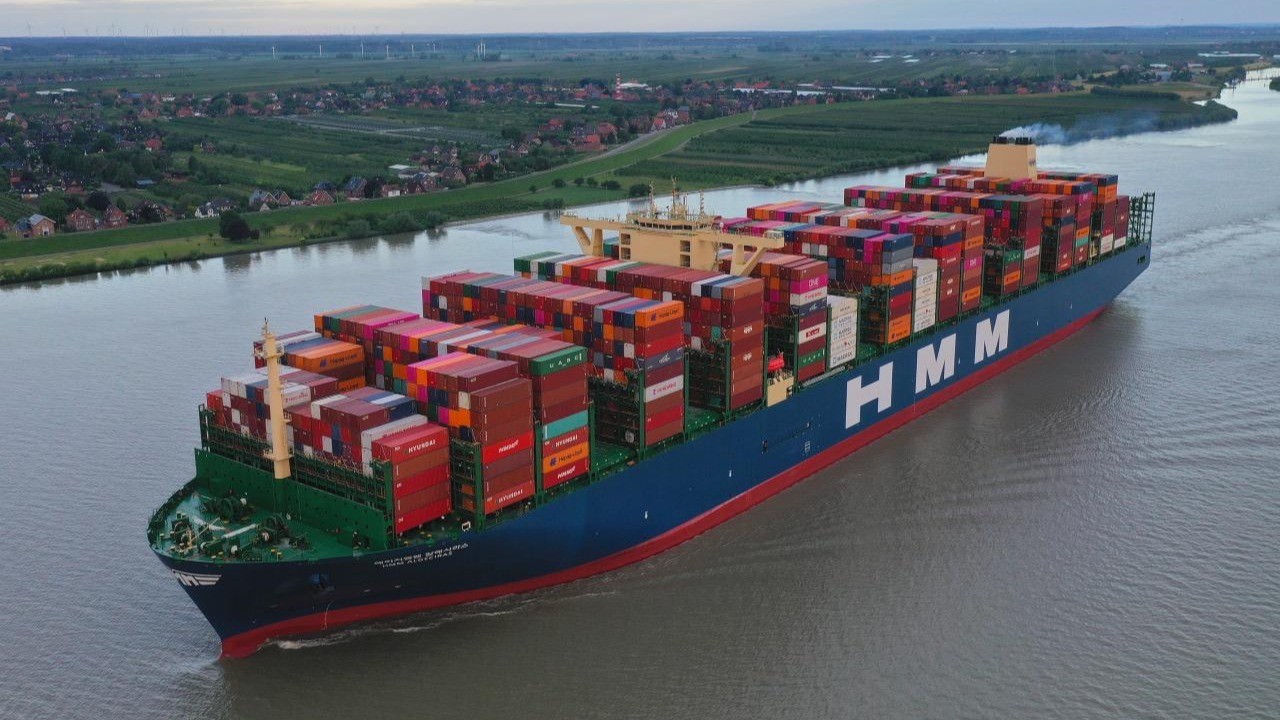
By June 2026, global containership capacity had exceeded 34 million teu, around 5.5% higher year on year and approximately 700,000 teu above the level at the end of 2025. Capacity deployed on the two major east–west corridors also expanded sharply, with Far East–Europe and Far East–North America capacity up around 9.5% and 9.3% respectively.
From a fleet perspective, this is no longer a conventionally tight market.
MSI estimates that global container demand increased by around 5% in the first half of 2026, broadly in line with supply growth. More ships are scheduled for delivery during the second half of the year, strengthening the argument that capacity should gradually begin to weigh on freight rates.
The problem is that nominal fleet capacity and effective transport capacity are not the same thing.
The 34 million teu recorded in global fleet statistics represents the nominal carrying capacity of ships. The amount of capacity that liner operators can actually sell to cargo owners depends on voyage duration, sailing speed, port waiting times, schedule disruption, container repositioning and the configuration of individual service networks.
A 15,000 teu vessel adds 15,000 teu to the global fleet the moment it is delivered. But if port congestion, diversion or schedule disruption allows that ship to complete fewer round voyages per year, its contribution to the market is materially lower than its nominal capacity would suggest.
That gap widened again during the summer.
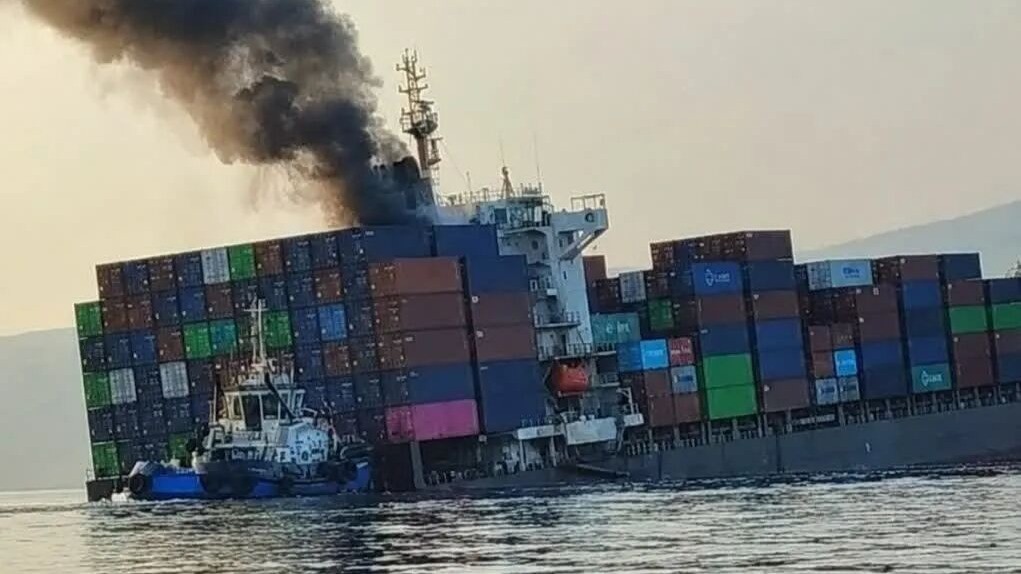
A series of typhoons disrupted major ports in China and across North Asia in late August and early September. Linerlytica estimated that global port congestion was absorbing around 3.92 million teu of vessel capacity in early September, equivalent to roughly 11% of the global container fleet. Around 2.5 million teu was waiting in North Asia alone, with berthing delays at Shanghai and Ningbo reportedly reaching as much as 10 days for some vessels.
Sea-Intelligence has measured the same problem using a different methodology. Global liner schedule reliability fell to 56.4% in July, with late vessels arriving more than six days behind schedule on average. The consultancy estimated that delays were effectively removing around 2.3 million teu of capacity from the market, equivalent to approximately 6.6% of the fleet.
The methodologies differ, but both point to the same operational reality: a significant part of the fleet counted in global supply statistics is currently not completing normal transport cycles.
The freight impact is straightforward.
If an Asia–North America service nominally requires 12 ships to maintain a weekly schedule, but port delays add several days to every round voyage, the carrier either has to inject additional tonnage or accept missed sailings and lower schedule reliability. Both outcomes reduce the volume of effective capacity available to shippers.
This is one of the reasons container freight markets have repeatedly behaved differently from what headline fleet-growth numbers might suggest.
During the pandemic, congestion absorbed huge amounts of capacity. From 2024 onwards, the Red Sea crisis extended sailing distances and increased vessel requirements. In 2026, the market has also had to absorb disruptions associated with the Strait of Hormuz, higher bunker costs, renewed Asian port congestion and repeated network adjustments.
The fleet is getting larger, but so is the amount of tonnage required to move the same volume of cargo.
Chinese exports remain supportive, but trade lanes are increasingly moving in different directions
Demand also continues to provide support.
Data used in the earlier assessment of the Chinese container market showed that China’s exports to ASEAN increased 22.9% year on year in the first half of 2026, with ASEAN accounting for 18.6% of total Chinese exports. Exports to the European Union increased 16.8%, lifting the EU share to 14.7%, while exports to the United States rose just 0.2%, reducing the US share to around 10.2%.
The composition of exports was also important. Machinery and electrical products increased 24.5%, with particularly strong growth in integrated circuits, vehicles and automatic data-processing equipment.
Chinese exports therefore remained resilient even as the geographical pattern of trade continued to change. Southeast Asia, Europe and emerging markets absorbed a larger proportion of outbound cargo, while the relative importance of the US market continued to decline.
MSI reached a similar conclusion in its August outlook. Analyst Daniel Richards identified the continuing competitiveness of Chinese manufactured exports as an important source of support for global container volumes, while estimating first-half global demand growth of around 5%.
But that demand is not evenly distributed across all routes, and that is becoming increasingly visible in freight rates.
Europe is already seeing the first clear signs of supply pressure and slower demand.
Drewry reported that Shanghai–Rotterdam and Shanghai–Genoa rates fell 5% and 10% respectively in the week to 3 September, extending an earlier downward trend. It also noted that the number of planned blank sailings on the Asia–Europe trade was expected to decline, allowing more capacity back into the market at a time when demand was softening.
The gradual return of some carriers to the Red Sea and Suez route is also beginning to matter.
By early September, a growing number of operators had begun testing passages through Bab el-Mandeb, the Red Sea and the Suez Canal. CMA CGM had completed multiple transits, Maersk had also increased its activity, while MSC and several Asian operators were selectively restoring passages.
The potential capacity effect is substantial.
Cape of Good Hope diversions have been estimated to absorb roughly 5% to 7% of the global containership fleet, equivalent to around 1.7 million to 2.4 million teu. If more Asia–Europe services resume normal Suez routings, sailing distances will shorten and some of the additional vessels previously required to maintain weekly services will be released.
Europe is particularly exposed to that change because it already absorbs a large proportion of the world’s largest new containerships. If demand softens at the same time as Suez normalization releases capacity and newbuildings continue to enter the trade, freight pressure is likely to emerge there first.
The transpacific is currently following a different path.
In early September, Asia–US spot rates strengthened again. Drewry recorded a 5% increase on Shanghai–Los Angeles and a 3% rise on Shanghai–New York. Market reports pointed to a relatively late seasonal push in cargo, partial implementation of 1 September general rate increases and continued capacity discipline by carriers.
More blank sailings were also announced for the transpacific, helping prevent available capacity from expanding as quickly as the overall fleet.
This does not contradict the earlier view that part of the US peak season had been front-loaded into the second quarter. Some demand was clearly brought forward, but year-end retail flows did not disappear entirely. Christmas and holiday cargo still has a final shipping window, and carriers retain considerable ability to influence short-term capacity through blank sailings, schedule changes and vessel redeployment.
The early-September rebound in US rates therefore does not necessarily signal another broad container bull market.
It does, however, show that newbuilding supply has not yet become the dominant force across every trade.
Carriers are managing supply much more actively
The container market has also changed in the way supply reaches individual trades.
Historically, analysts often treated supply as a relatively fixed variable: ships delivered in a given year were compared with projected cargo growth, and the difference provided a rough guide to the likely direction of freight rates.
That framework is increasingly incomplete.
Carriers can now adjust short-term effective supply through blank sailings, slower steaming, schedule consolidation, port omissions, service restructuring and vessel redeployment. In concentrated east–west trades, these decisions can materially change how much space is actually offered to shippers in any given week.
The transpacific market in early September provides a good example. Global containership capacity is at a record high, yet spot rates increased because cargo demand remained sufficiently firm while carriers simultaneously removed capacity through blank sailings.
Europe showed the opposite dynamic: fewer blank sailings, more available capacity and weaker cargo demand translated into falling rates.
For cargo owners and freight forwarders, the key supply question is therefore no longer simply how many ships exist globally. It is how much capacity carriers are actually putting into a specific trade in a specific week.
For liner operators, the calculation is equally complex. They are constantly balancing load factors, freight rates and market share. Reducing sailings can support pricing, but cutting too much capacity risks surrendering cargo to competitors.
Capacity management can slow a downturn, but it cannot indefinitely neutralize a large structural increase in fleet supply.
When new deliveries are moderate, blank sailings can be highly effective. When large numbers of new vessels arrive continuously, it becomes increasingly difficult to absorb all of them through schedule management. Those ships represent major capital commitments and must eventually be deployed somewhere.
This is one of the reasons the distinction between 2026 and 2027 matters.
A firm charter market shows that the industry is not short of every type of ship
The charter market remains another important part of the picture.
MSI noted in August that the container charter market remained strongly in favour of shipowners, particularly for vessels below 8,000 teu. Supply in many of these size classes remains limited, and liner companies continue to seek additional ships to support their networks.
That remained the case into September.
As congestion worsened at Shanghai and Ningbo, demand for replacement and extra tonnage increased again. Many vessels above 4,000 teu had already been fixed months in advance, leaving very little prompt tonnage available in the short-period charter market.
The explanation lies in the structure of the containership orderbook.
Much of the investment during recent ordering cycles has been concentrated in vessels above 12,000 teu, including large numbers of LNG- and methanol-capable ships. By comparison, fleet growth in many feeder and midsize segments has been much more limited, while the age profile of those ships has continued to rise.
A 24,000 teu vessel cannot simply replace a 2,500 teu feeder ship. Nor can a 15,000 teu vessel be deployed efficiently on every regional service, where draught restrictions, port infrastructure and cargo volumes impose practical limits.
The industry can therefore simultaneously have record total containership capacity and shortages in individual vessel classes.
For non-operating owners, that remains supportive. As long as carriers continue to compete for midsize and smaller tonnage, charter rates can remain strong, particularly where owners have already secured multi-year employment.
For liner companies, however, the combination is less comfortable. Spot freight rates may begin to soften while charter hire remains expensive. Bunker, port and disruption-related costs also tend to fall more slowly than freight revenues.
Profit margins can therefore compress faster than headline freight indices imply.
Spot freight, charter markets and newbuilding supply are currently moving through different stages of the cycle.
2026 can still absorb capacity. The 2027 test will be harder
MSI’s longer-term assessment places particular emphasis on timing.
Newbuilding deliveries will continue to increase through the second half of 2026, but the more substantial structural supply challenge is expected from 2027 onwards.
New containership contracting has slowed from last year’s extreme pace. By mid-August, around 1.9 million teu of new orders had reportedly been placed in 2026, significantly below roughly 5 million teu in 2025. Some of the latest orders have also shifted towards smaller and midsize vessels.
That slowdown does little to change the near-term delivery pipeline.
A large volume of ships ordered in previous years is already under construction and will be delivered in 2027 and 2028. Many are large or ultra-large vessels destined initially for the major east–west trades.
There is also limited demolition potential in the same size categories.
Many 20-year-old ships in the global fleet are in the 2,000–4,000 teu range. The 15,000 teu, 18,000 teu and 24,000 teu vessels scheduled for delivery over the next two years generally do not have a similarly large pool of elderly ships available for one-for-one replacement.
Supply pressure will therefore spread through cascading.
A new 24,000 teu ship enters an Asia–Europe service. An existing 18,000 teu vessel moves to another trade. A 10,000 teu ship is displaced into a secondary route. Eventually, capacity is pushed progressively down through the network.
As long as cargo growth is strong enough, cascading can be absorbed.
If global trade slows at the same time as Red Sea diversions ease and port congestion improves, the transmission of surplus capacity through the network will accelerate.
This is why strong 2026 freight rates should not be interpreted as evidence that the industry has permanently absorbed the orderbook.
This year, several exceptional factors have helped consume capacity simultaneously. Red Sea diversions require more ships. Port congestion ties up more ships. Hormuz-related disruption has affected deployment. Chinese exports have remained resilient. Seasonal cargo surges have periodically tightened space.
With all of those factors acting together, even a fleet above 34 million teu can still appear tight.
If two or three of them weaken at the same time in 2027, the market could look very different.
From a broad rally to a market of divergence
The second half of 2026 is increasingly becoming a story of divergence.
The first half was driven by a relatively coherent set of forces. Hormuz-related risk lifted bunker and insurance costs, tariff uncertainty encouraged front-loading, Asian exports remained strong, Red Sea diversions continued to absorb ships, and congestion reduced fleet efficiency. Together, these factors pushed the Ningbo Containerized Freight Index sharply higher, with the composite index reaching 2,440.2 points by late June, up 88.3% from the start of the year.
By September, that synchronized market had started to break apart.
Europe is weakening under softer demand, increased vessel supply and the gradual restoration of Suez transits. The transpacific is still supported by late-season cargo and blank sailing programmes. Southeast Asia and South America remain comparatively firm. Persian Gulf and Red Sea trades continue to reflect geopolitical risk, surcharges and regional capacity constraints. At the same time, severe congestion in Shanghai, Ningbo and other Asian hubs is keeping millions of teu of nominal ship capacity from operating normally.
In that context, MSI’s earlier view that spot rates may have peaked is better understood as a statement about the broad global upswing, rather than a prediction that every trade is about to enter a sustained decline.
The market-wide rally may be losing momentum. Individual trades are increasingly being driven by their own fundamentals.
Europe may remain under pressure. US rates could retain short-term resilience. Middle East trades will continue to react to geopolitical risk. Regional routes will depend increasingly on local cargo growth and the availability of suitable ships.
The indicators that matter over the next several months are therefore becoming more specific.
The pace of Suez normalization will determine how much effective capacity is released into Asia–Europe services. The easing of congestion in Shanghai, Ningbo and other Asian ports will determine how quickly currently delayed tonnage returns to normal circulation. The strength of Chinese exports to ASEAN, Europe and emerging markets will determine how much new capacity can be absorbed by genuine cargo growth. Carrier blank-sailing programmes will influence how quickly structural oversupply translates into lower freight rates.
Behind all of those short-term variables, the orderbook continues to move closer to delivery.
A 34 million teu fleet is only the current starting point. The number will continue to rise.
Geopolitical disruption, congestion and trade growth have so far created enough friction to absorb much of the additional capacity, while the rebound in the SCFI to 3,590.05 points in early September shows that the market is still some distance from becoming uniformly loose.
But new ships ultimately need real cargo.
Congestion will eventually ease. Blank sailings can delay, but not eliminate, surplus capacity. Diversions may also normalize.
As those temporary capacity absorbers retreat, the ability of global trade growth to keep pace with fleet expansion will become increasingly visible in freight rates.
For that reason, the second half of 2026 is unlikely to produce a smooth downward curve.
Europe may weaken first. US rates may rebound periodically. Regional trades may move in different directions. Carriers will continue using blank sailings to manage supply. Congestion and geopolitical events will periodically tighten local markets, while the charter market follows its own cycle.
That divergence may persist until the next major wave of large newbuildings enters the market in 2027.
By then, the question facing container shipping will become more direct:
If voyage distances normalize and port efficiency improves, can global trade growth still absorb a containership fleet that continues to expand at this pace?