OPEC released its much anticipated April monthly report.
Crude Oil Price Movements
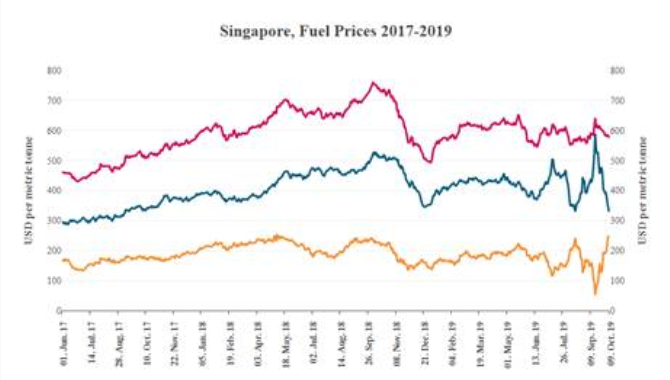
Crude oil prices collapsed in March 2020, recording their deepest monthly drop since the global financial crisis in 2008. The ramifications of the COVID-19 pandemic were the main driving force, resulting in unprecedented worldwide oil demand shock and massive sell-offs in the global oil markets, amid a significant crude surplus. The OPEC Reference Basket (ORB) value was down by $21.61, or 38.9%, m-o-m, to stand at $33.92/b, the lowest monthly value since September 2003. ICE Brent declined by $21.75, or 39.2%, m-o-m, to average $33.73/b, while NYMEX WTI fell $20.09, or 39.8%, to average $30.45/b. The term structure of all three crude benchmarks – ICE Brent, NYMEX WTI and DME Oman – moved to a super contango in March, and money managers cut speculative net long positions.
World Economy
The world economy is forecast to face a severe recession in 2020, declining by 1.5%, following global economic growth of 2.9% in the previous year. Following tender signs of improvement at the beginning of the year, expectations for global economic growth were quickly burdened by the strong impact of the COVID-19 pandemic. Within the OECD, the US is forecast to contract by 4.1% in 2020, following growth of 2.3% in 2019. An even larger decline is expected in the Euro-zone, where economic activity is forecast to fall by 6.0% in 2020, compared to growth of 1.2% in 2019. Japan is forecast to contract by 3.9% in 2020, comparing to growth of 0.7% in 2019. China’s 2020 GDP is forecast to grow by 1.5%, recovering from a sharp contraction in 1Q20 and following growth of 6.1% in 2019. India is forecast to grow by only 2.0%, a sharp slowdown from already weakening growth of 5.3% in 2019. Brazil’s economy is forecast to contract by 2.4% in 2020, following growth of 1.0% in 2019. Russia’s economy is forecast to contract by 0.5% in 2020, after growth of 1.4% in 2019, not only due to COVID-19, but also because of the considerable decline in oil prices. As risk remains to be skewed to the downside, further revisions may be warranted going forward.
World Oil Demand
World oil demand growth forecast for 2019 is kept unchanged at 0.83 mb/d, compared with the previous month’s assessment. For 2020, the world oil demand growth forecast is revised lower by 6.9 mb/d, to a historical drop of around 6.8 mb/d. The contraction in the 2Q of this year is expected to be around 12 mb/d, with April witnessing the worst contraction at about 20 mb/d. The impact of the COVID-19 outbreak in China in 1Q20, and its negative impact on transportation and industrial fuels in the country, has since spread globally and is now affecting oil demand growth in most other countries and regions, with an unprecedented impact on global oil demand, transportation fuels in particular. As a result, OECD oil demand is revised lower by 3.7 mb/d to decline by 4.0 mb/d, while non-OECD oil demand growth is adjusted lower by 3.2 mb/d to contract by 2.9 mb/d for the year. Considering latest developments, and the large uncertainties going forward, downward risks remain significant, suggesting possibility of further adjustments, especially in the 2Q, should new data and further developments warrant revisions.
World Oil Supply Non-OPEC oil supply growth in 2019 is revised down by 0.01 mb/d from the previous month’s assessment and is now estimated at 1.98 mb/d. For 2020, non-OPEC oil supply is forecast to decline by 1.50 mb/d, a downward revision of 3.26 mb/d from the previous projection. The impact of COVID-19, ensuing global economic recession and oil demand shock, will also lead to supply disruptions. Benchmark oil prices plunge prompted companies to respond by cutting capital expenditure to the lowest in 13 years. The 2020 oil supply growth forecast for the US was revised down by 1.05 mb/d to show a decline of 0.15 mb/d y-o-y. The supply growth for the 10 non-OPEC countries participating in the Declaration of Cooperation has also been adjusted lower. Oil supply in 2020 is now forecast to show growth only in Norway, Brazil, Guyana and Australia. OPEC NGLs production in 2019 is estimated to have grown by 0.04 mb/d to average 4.79 mb/d and for 2020 will grow by 0.04 mb/d to average 4.83 mb/d. In March, OPEC crude oil production increased by 821 tb/d m-o-m to average 28.61 mb/d, according to secondary sources.
Product Markets and Refining Operations
Global refinery margins globally showed mixed performance during March. In the US, margins weakened as strength in gasoil/diesel was offset by losses in gasoline cracks, as complex margins came close to negative territory. In Europe, product markets strengthened slightly at the middle of the barrel, supported by a fall in feedstock prices. An already relatively tight global gasoil market saw support from output cuts and continued critical industrial activities for essential services and goods amid COVID-19. However, in Asia, margins eased towards the end of the month, pressured by a weaker top of the barrel, despite healthy gasoil and fuel oil crack spreads.
Tanker Market
The tanker market has been one of few segments of the oil industry that enjoyed positive momentum in March. A sudden surge in crude exports boosted demand for VLCCs, which pulled up Suezmax rates as well. Dirty spot freight rates declined mid-month before climbing again as the market was supported by high demand for tankers as charterers rushed to place cargoes amid a collapse in demand due to the COVID-19 pandemic. Increased options for time-chartering, including for floating storage, underscored the build-up of excess supply of crude and products in the market. For the month, dirty spot rates averaged 69% higher m-o-m in March. Clean tanker spot freight rates rose 12% m-o-m, as the need to find homes for excess product supplies supported the market.
Trade
Crude and product trade flows have been notably affected by the COVID-19 pandemic and the uncertain outlook going forward, although there has been some lag in how the various regions have been affected. US crude exports had a strong start to the year, averaging 3.5 mb/d in 1Q20, a gain of 0.8 mb/d over the same quarter last year, as the US remained a net liquids exporter for the seventh-consecutive month. Meanwhile, China’s crude imports averaged 10.5 mb/d over the first two months of 2020, declining from December as disruptions caused by COVID-19 led to some imports being diverted or delayed. Product trade was also affected, with imports and exports averaging 0.3 mb/d lower in the first two months of the year compared to December. Official data showed India’s crude imports increasing slightly in February, although some estimates show a higher jump as the country took in some discounted cargoes diverted from China. India’s crude and product trade is likely to be broadly impacted in March by a government-ordered lockdown.
Stock Movements
OECD commercial oil stocks rose by 5.6 mb, m-o-m, in February to stand at 2,945 mb. This was 64.3 mb higher than the same time one year ago and 24.7 mb above the latest five-year average. Within components, crude stocks fell by 6.1 mb, while product stocks rose by 11.7 mb, m-o-m. In terms of days of forward cover, OECD commercial stocks rose by 5.0 days, m-o-m, in February to stand at 72.7 days. This was 11.5 days above the same period in 2019, and 10.3 days above the latest five-year average. Preliminary data for March showed that US total commercial oil stocks increased by 8.2 mb, m-o-m, to stand at 1,922 mb. This was 31.8 mb, or 1.7%, above the same period a year ago, and 16.2 mb, or 0.8%, lower than the latest five-year average. Within components, crude stocks rose by 25.1 mb, while product stocks fell by 16.8 mb, m-o-m.
Balance of Supply and Demand
Demand for OPEC crude in 2019 stood at 29.9 mb/d, 1.2 mb/d lower than the 2018 level. Following the recent agreement reached at the extraordinary OPEC and non-OPEC Ministerial Meetings, the demand for OPEC crude in 2020 is expected at 24.5 mb/d, around 5.4 mb/d lower than the 2019 level, though this remains heavily subject to uncertainty surrounding current market conditions.
Source:OPEC
The opinions expressed herein are the author's and not necessarily those of The Xinde Marine News.
Please Contact Us at:
media@xindemarine.com


.gif)


 Baltic Exchange launches new Fuel Equivalence Conve
  21 Consecutive Years of QUALSHIP 21 Recognition for
  MPA and Wärtsilä Renew Partnership to Drive Marit
  MPA and Dalian Maritime University Renew Partnershi
  PSA INTERNATIONAL, DNV AND PACIFIC INTERNATIONAL LI
  INTERCARGO Reaffirms Call for Simplicity as IMO Cli