Two months on from the initial sanctions on Russian crude, we take a look at the impact that these restrictions have had on the Tanker markets. Additionally, we analyse the impact of the new round of sanctions on refined petroleum products that came into force on 5th February 2023.
In the run up to the December 5th sanctions, we saw Tanker markets skyrocket for all sectors, with Aframax TCE’s hitting record highs of 125,700 USD/Day. February signalled new restrictions to clean exports from Russia but to date, the clean market has not reacted in the same way as crude. Instead, MR rates plummeted to an 11 month low, falling to 10,319 USD/Day, compared to the peak of almost 75,000 USD/Day on 5th December 2022.
What has been the impact so far?
Since the escalation of the hostilities between Russia and Ukraine, there has been a significant decrease in the dependence of Europe on Russian oil exports.
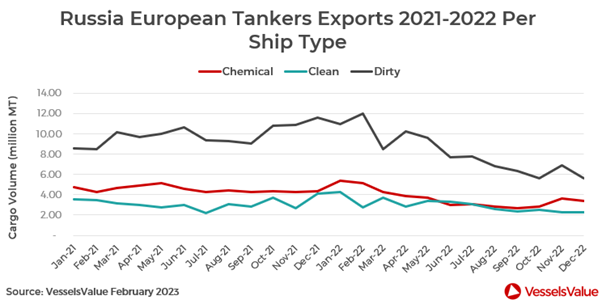
Figure 1: Russian Tanker Exports (2021 to 2022).
By the end of December, Tanker exports from Russia to Europe had fallen for chemicals, clean and dirty. In comparison to January 2021, in December, Russian chemical exports were down by c.28% from 4.75 million MT to 3.41 million MT. Clean exports were down by c.36% from 3.58 million MT to 2.30 million MT, while dirty Tanker shipments were down by c.34% from 8.59 million MT to 5.65 million MT.
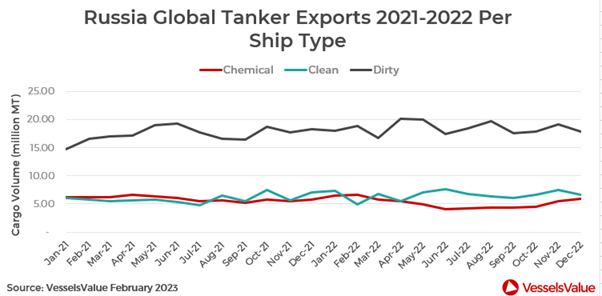
Figure 2: Russian Global Tanker Exports (2021 to 2022).
Where is the Russian oil going?
VesselsValue Trade data shows that Russian Tanker exports for dirty, clean and chemical Tankers have remained relatively stable over the past two years. The sanctions on Russian oil seem to have had very little impact on overall export levels. This indicates that trade flows have changed, moving away from the European market that was previously the most significant destination for Baltic and Arctic shipments. Instead, shipments are travelling further afield to countries such as India, China, Türkiye, and the UAE, countries that have seen significant increases in imports of Russian oil cargoes since 2021.
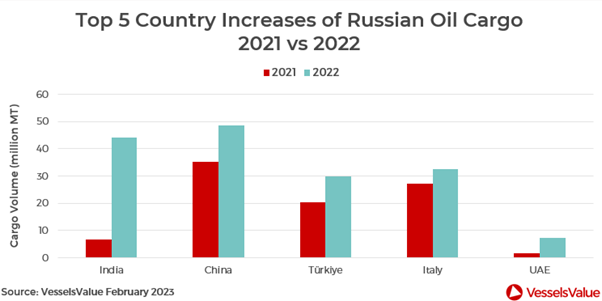
Figure 3: Top 5 Country Increases in Russian Oil Cargo.
India saw an exponential rise in Russian oil cargoes last year, with a YoY rise of c.577% from 6.5 million MT in 2021 to 44 million MT in 2022. China, which was already the largest importer of Russian oil globally, also increased volumes by c.38% YoY from a 2021 total of 35 million MT to c.49 million MT last year.
Türkiye’s refusal to comply with EU sanctions came as a surprise to many. Although they are not an EU member, the country has applied for EU accession and is a member of the North Atlantic Treaty Organization (NATO). In the meantime, the nation has become a ‘transit hub’ for Russia, which has enabled the economic blockade to be bypassed. This cooperation has resulted in an increase in oil cargoes of 47% year on year from c.20 million MT to c.30 million MT.
Italy was the only country within the EU to have increased imports from Russia in 2022, increasing by c.21% from 27 million MT in 2021 to 33 million MT in 2022. This was largely due to a refinery in Sicily, which was owned by Russia’s Lukoil. It was recently announced that Lukoil has since reached an agreement to sell the refinery to Geneva based Trafigura.
Russian imports to the UAE have also seen a huge percentage increase of c.313% year on year from 1.7 million MT in 2021 to 7 million MT in 2022. Interestingly, Tanker sales to undisclosed buyers based in the UAE and Middle East quadrupled YoY, and the average age of these Tankers bought in 2022 was 18 years.
How is the oil being transported?
Since Q4 of 2022, there has been a significant rise in the number of Tankers sold to undisclosed buyers in both the crude and the clean sectors. In the MR2 sector, there were 27 sales reported in 2022, compared to just five sold in 2021. The average age of these Tankers was 16 years and this has been supporting a firming of values, particularly for vintage units which have seen the most impressive gains.
For example, 45,000 DWT, 20YO MR2s increased by c.123.5% from USD 656 mil to USD 14.66 mil in 2022, the highest levels seen since October 2008. As the increase in this type of sales coincides with the introduction of sanctions on Russian crude, we can make the assumption that these are new players to the market. These are players who are looking to take advantage of the premiums available for trading in Russian crude, regardless of the implications that this might have.
What does this mean for Tankers?
Volatility has returned to the MR sector once again in the first few weeks of trading since the latest round of sanctions have come into force. Rates have bounce back up once again, up by c.397% WoW from 11,065 USD/Day at the start of February to a peak of 55,060 USD/Day, driven by increased demand from the US Gulf, combined with fewer ships available.
MR values have dipped slightly since the start of the year; five year old vessels of 50,000 DWT are down by c.5.91% from USD 44.15 mil to USD 41.54 mil, but remain at the highest levels since 2008.
Conclusion
With export levels relatively unchanged, it is debatable if sanctions are having any meaningful economic impact on Russia. There are reports that Russian crude is being refined in places such as China, and then being sold back to EU countries as clean petroleum products. If the sanctions remain in place, we expect the ‘dark fleet’ will continue to operate for the foreseeable future. With fewer Tankers available, tighter tonnage supply, combined with changes to trade flow patterns for Russian oil and refined products, there should be support for both crude and clean rates in the future.
VesselsValue data as of February 2023.
Source: VesselsValue
The opinions expressed herein are the author's and not necessarily those of The Xinde Marine News.
Please Contact Us at:
media@xindemarine.com


.gif)


 Ningbo Containerized Freight Index Weekly Commentar
  Ningbo Containerized Freight Index Weekly Commentar
  BIMCO Shipping Number of the Week: Bulker newbuildi
  Ningbo Containerized Freight Index Weekly Commentar
  Ningbo Containerized Freight Index Weekly Commentar