Long-term rates "through the roof" for trades into New Zealand and Australia, with some contracts up over 400% since 2019
The latest data from Xeneta shows a huge jump in the cost of long-term ocean freight rates into Australasia, with all main routes more than twice as expensive as this time last year. Meanwhile, increases since July 2019 threaten to “rewrite industry record books”, according to Xeneta’s Chief Analyst Peter Sand.
Out with the old
“The global market for container shipping is in overdrive, much to the pain of shippers and adding to the huge profits of our leading carriers,” he comments. “Nowhere is this more obvious that with the chief trades – from China, South East Asia and Northern Europe – into Australia and New Zealand.
“Although the data on our platform shows a stabilization of average rates for long-term agreements in recent months, the fact that they’re replacing older ones at much, much lower levels mean the average for all valid contracts has been pushed ‘through the roof’ for many already cash-strapped shippers.”
Trade intelligence
Xeneta's data shows that despite falling import volumes over the first five months of the year - down 7.6% into Australia and 13.5% to New Zealand – rates are at record highs. The biggest trade into the region, from the Far East, illustrates this, with the average long-term rate on 1 July standing at USD 7 600 per FEU. This is more than twice July 2021’s figure, and a huge 375% up against July 2019.
However, the largest percentage surge has been seen in agreements from South East Asia, which are up more than 420% since summer 2019 (currently USD 7 800 per FEU, a climb of USD 6 300 over the last three years). In the last year alone, the average for long-term contracts has shot up by close to USD 5 000 per FEU (from USD 2 900 per FEU in July 2021), making this the corridor with the largest annual increase.
Finally, long-term rates from North Europe are the most expensive of the main trades - and the only ones above USD 8 000 per FEU - having risen 160% since July last year. This is despite the fact volumes here have fallen 4.2% year-on-year in the first five months of 2022.
New demands
“In an increasingly complex world, we can no longer rely on the old rules of thumb to predict rates developments and accurately assess the supply-demand picture,” Sand concludes. “All parties planning ocean freight strategies, and entering negotiations, need to have the latest data to gain whatever competitive advantage they can.
“It’s tough out there and, from what we can see here, especially for those shippers with their sights set on these key Australasian markets.”
Xeneta's data shows that, in the first five months of the year, 41% of total containerized imports to Australia came from China, with 20% from South East Asia. The respective figures for the two corridors into New Zealand are 22% and 13%.
Oslo-based Xeneta's unique software platform compiles the latest ocean and air freight rate data aggregated worldwide to deliver powerful market insights. Participating companies include ABB, Electrolux, Continental, Unilever, Nestle, L’Oréal, Thyssenkrupp, Volvo Group and John Deere, amongst others.
The opinions expressed herein are the author's and not necessarily those of The Xinde Marine News.
Please Contact Us at:
media@xindemarine.com


 Ningbo Containerized Freight Index Weekly Commentar
  Ningbo Containerized Freight Index Weekly Commentar
  Ningbo Containerized Freight Index Weekly Commentar
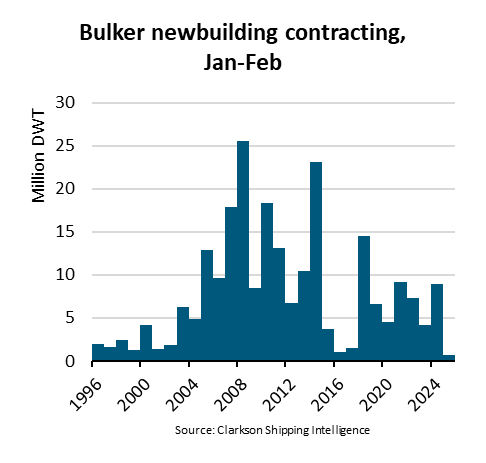
  BIMCO Shipping Number of the Week: Bulker newbuildi
  Ningbo Containerized Freight Index Weekly Commentar
  Ningbo Containerized Freight Index Weekly Commentar