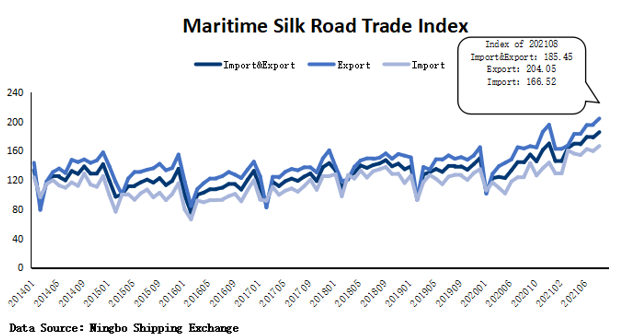
In August 2021, the Maritime Silk Road Trade Index (STI) released by the Ningbo Shipping Exchange showed that the import and export trade index was 185.45 points,up 4.24% from the previous month and up 28.84% year-on-year; the export trade index was 204.05 points,up 4.12% from the previous month,an increase of 25.10% year-on-year;the import trade index was 166.52 points,up 4.38% month-on-month and up 33.83% year-on-year.
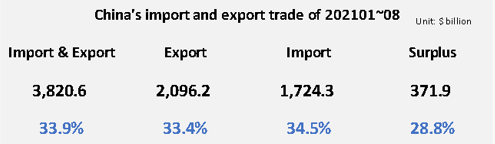
From January to June, China total import and export trade value was US$2,781.6 billion,a year-on-year increase of 37.1%.The total export trade value was US$1,519.3 billion,a year-on-year increase of 38.3%;the total import trade value was US$1,262.3 billion,a year-on-year increase of 35.6%.
China's trade with continents
From January to August , the import and export trade value between China and Asia was US$1,929.9 billion, up 31.3% year-on-year, accounting for 50.5% of China's total import and export value. The export trade value was 988.2 billion U.S. dollars, up 31.7% year-on-year; the import trade value was 941.8 billion U.S. dollars, up 30.9% year-on-year.
From January to August , the import and export trade value between China and Europe was US$744.0 billion, up 32.4% year-on-year, accounting for 19.5% of China's total import and export value. The export trade value was 435.6 billion U.S. dollars, up 31.1% year-on-year; the import trade value was 308.4 billion U.S. dollars, up 34.2% year-on-year.
From January to August , the import and export trade value between China and Africa was US$162.0 billion, up 39.2% year-on-year, accounting for 4.2% of China's total import and export value. The export trade value was 94.1 billion U.S. dollars, up 36.0% year-on-year; the import trade value was 67.9 billion U.S. dollars, up 43.9% year-on-year.
From January to August , the import and export trade value between China and North America was US$522.1 billion, a year-on-year increase of 36.2%, accounting for 13.7% of China's total import and export value. The export trade value was 386.1 billion U.S. dollars, up 32.8% year-on-year; the import trade value was 136.0 billion U.S. dollars, up 46.9% year-on-year.
From January to August , the import and export trade value between China and Latin America was US$287.3 billion, a year-on-year increase of 46.6%, accounting for 7.5% of China's total import and export value. The export trade value was 142.4 billion U.S. dollars, up 59.4% year-on-year; the import trade value was 144.9 billion U.S. dollars, up 36.0% year-on-year.
From January to August , the import and export trade value between China and Oceania was US$173.7 billion, up 38.4% year-on-year, accounting for 4.5% of China's total import and export value. The export trade value was 49.8 billion U.S. dollars, up 27.3% year-on-year; the import trade value was 123.9 billion U.S. dollars, up 43.4% year-on-year.
Source: Ningbo Shipping Exchange
The opinions expressed herein are the author's and not necessarily those of The Xinde Marine News.
Please Contact Us at:
media@xindemarine.com


.gif)


 Ningbo Containerized Freight Index Weekly Commentar
  Ningbo Containerized Freight Index Weekly Commentar
  BIMCO Shipping Number of the Week: Bulker newbuildi
  Ningbo Containerized Freight Index Weekly Commentar
  Ningbo Containerized Freight Index Weekly Commentar