In the past year the spikes in the Capesize index have generally been accompanied by some form of ballaster tightness and this rally is no different, however so far it appears the rally is out of proportion to this ballaster deficit.
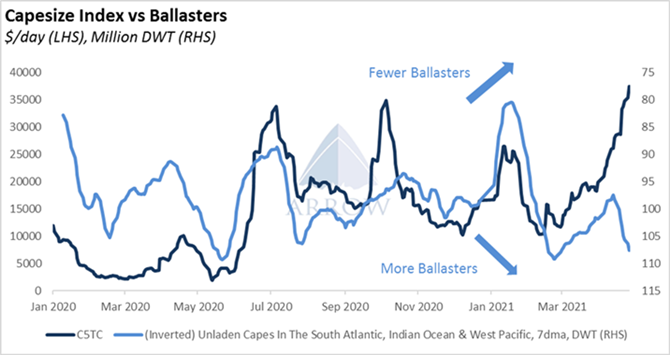
We can see that the number of unladen Capes in the South Atlantic, Indian and West Pacific has been overall on a shrinking trend in the past 2 months*, but this is now seemingly in reversal. Therefore, one may naturally assume a softening in the index will follow should this reversal continue. So why has the index and FFAs rocketed higher when there doesn't appear to be an especially acute tightness?
*the chart is inverted for the purpose of illustrating the correlation with the C5TC
One might suggest that this is just a typical up & down Capesize mini-cycle, and soon things will go back to normal. Alternatively, one may consider that this is the first warning shot of a greater upcycle for the Capesize market as an increasing amount of cargo is met by a slow growing fleet. And that whilst the index may decline in the coming weeks/months, we will be in a market with a higher base level of rates.
Our bias is the latter. Firstly, the ballaster numbers we refer to are derived from AIS tracking data, not from compiled lists, and therefore include fixed vessels. The number of open vessels within the ballasters remain few and far between. We don't expect this to change materially in the near term as C5 is currently offering more attractive returns than C3, and provide little incentive for owners to take themselves out of the market for 80-85 days to ballast to the Atlantic.
Secondly, demand remains exceptionally strong, particularly from China, and outweighs any influx of ballasters. Strong demand is driven by healthy steel margins and strict emissions restrictions which incentivize Chinese steelmakers to use higher quality iron ore coming out of Brazil.
Ultimately the dry cargo market fundamentals are improving, and the supply-demand balance is tightening. Any disturbance to the rhythm of the flow of vessels is going to increasingly have a greater impact on the index.
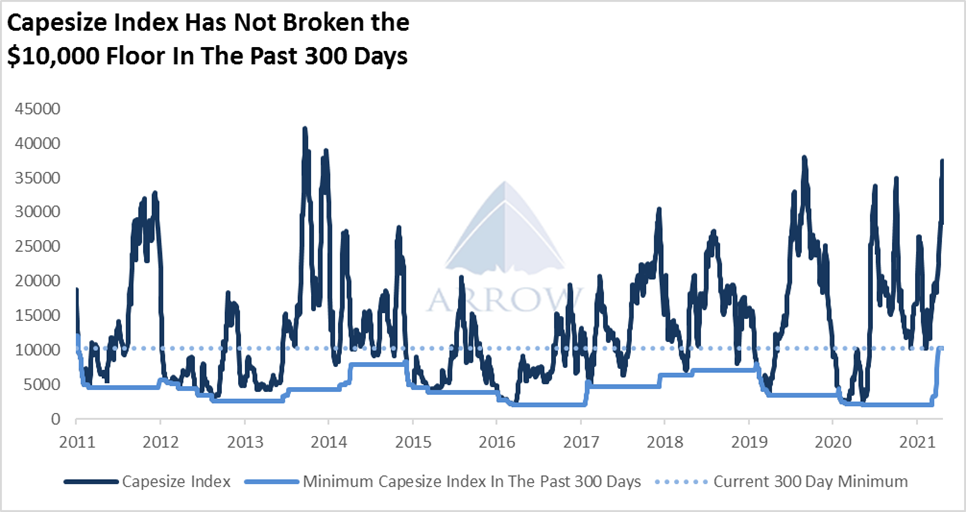
Whilst the focus on the market's attention has been at the top right of the Capesize Index chart, equally as important is the bottom right corner. In the past 300 days there has not been a single Capesize Index below $10,000, and this is the first time that has happened since 2011. The floor of the market appears to be rising as the fundamentals improve.
The opinions expressed herein are the author's and not necessarily those of The Xinde Marine News.
Please Contact Us at:
media@xindemarine.com


.gif)


 Ningbo Containerized Freight Index Weekly Commentar
  Ningbo Containerized Freight Index Weekly Commentar
  BIMCO Shipping Number of the Week: Bulker newbuildi
  Ningbo Containerized Freight Index Weekly Commentar
  Ningbo Containerized Freight Index Weekly Commentar