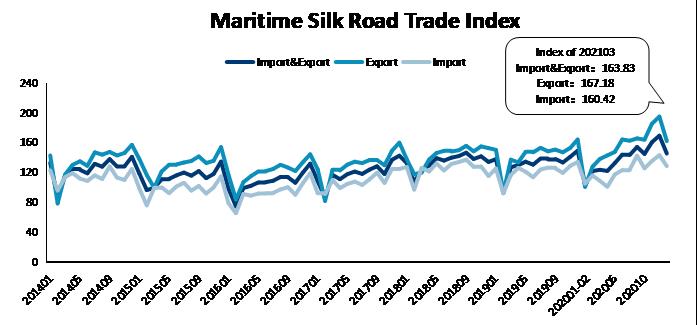
In March 2020, the Maritime Silk Road Trade Index (STI) released by the Ningbo Shipping Exchange showed that the import and export trade index was 163.83 points,up 33.70% year-on-year; the export trade index was 167.18 points,an increase of 30.24% year-on-year;the import trade index was 160.42 points,up 37.57% year-on-year.
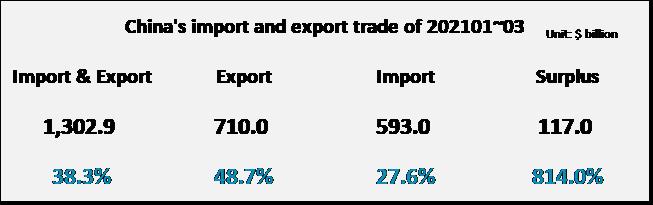
From January to March, China total import and export trade value was US$1,302.9 billion,a year-on-year increase of 38.3%.The total export trade value was US$710.0 billion,a year-on-year increase of 48.7%;the total import trade value was US$593.0 billion,a year-on-year increase of 27.6%.
China's trade with continents
From January to March, the import and export trade value between China and Asia was US$663.4 billion, up 32.0% year-on-year, accounting for 50.9% of China's total import and export value. The export trade value was 338.8 billion U.S. dollars, up 37.2% year-on-year; the import trade value was 324.6 billion U.S. dollars, up 26.9% year-on-year.
From January to March, the import and export trade value between China and Europe was US$255.3 billion, up 42.3% year-on-year, accounting for 19.6% of China's total import and export value. The export trade value was 147.8 billion U.S. dollars, up 57.8% year-on-year; the import trade value was 107.5 billion U.S. dollars, up 25.3% year-on-year.
From January to March, the import and export trade value between China and Africa was US$51.9 billion, up 25.9% year-on-year, accounting for 4.0% of China's total import and export value. The export trade value was 29.8 billion U.S. dollars, up 39.0% year-on-year; the import trade value was 22.1 billion U.S. dollars, up 11.7% year-on-year.
From January to March, the import and export trade value between China and North America was US$183.6 billion, a year-on-year increase of 71.9%, accounting for 14.1% of China's total import and export value. The export trade value was 130.1 billion U.S. dollars, up 74.8% year-on-year; the import trade value was 53.4 billion U.S. dollars, up 65.2% year-on-year.
From January to March, the import and export trade value between China and Latin America was US$92.3 billion, a year-on-year increase of 34.9%, accounting for 7.1% of China's total import and export value. The export trade value was 46.2 billion U.S. dollars, up 56.2% year-on-year; the import trade value was 46.1 billion U.S. dollars, up 18.6% year-on-year.
From January to March, the import and export trade value between China and Oceania was US$55.9 billion, up 28.0% year-on-year, accounting for 4.3% of China's total import and export value. The export trade value was 17.3 billion U.S. dollars, up 49.4% year-on-year; the import trade value was 38.6 billion U.S. dollars, up 20.3% year-on-year.
Source: Ningbo Shipping Exchange
The opinions expressed herein are the author's and not necessarily those of The Xinde Marine News.
Please Contact Us at:
media@xindemarine.com


.gif)


 Ningbo Containerized Freight Index Weekly Commentar
  Ningbo Containerized Freight Index Weekly Commentar
  BIMCO Shipping Number of the Week: Bulker newbuildi
  Ningbo Containerized Freight Index Weekly Commentar
  Ningbo Containerized Freight Index Weekly Commentar