FBX Index: Don't be fooled

The container shipping market has gone through a period of extreme uncertainty and volatility in 2020, and it would only be natural for market participants to be hoping for more stability in 2021.
The carriers' success with tactical capacity management during the pandemic outbreaks in early 2020 – also more colloquially known as blank sailings – resulted in the overall global FBX rate index remaining fairly constant in a band between roughly $1300-$1500. However, once the demand boom began followed by increasing bottleneck problems related first to vessels, then equipment, then terminals, and ports, the impact on pricing became unprecedented. In the first month of 2021, we appear to see a plateau just above the $4000 mark.
In the coming period, all eyes will be on signs as to whether the bottleneck problems are abating and whether the demand boom continues. It is in this phase that everyone should be aware that the normal measurements of both supply and demand growth will temporarily become useless.
This might sound unduly harsh, but mathematically it is actually correct. The norm in the industry is to measure both demand and supply growth on a year-on-year basis. Under normal circumstances, this is a good way of performing the measurement as it automatically takes seasonal effects into account – although the changing nature of Chinese New Year means that for January and February the industry standard is also to only compare the sum of the two months against prior year to eliminate this effect of a changing date.
2021 will be very different.
The issue is simple. Let us take a look at capacity first. During the pandemic peak impact in April and May, some trades saw blank sailings range up to 20-30% of the capacity on offer. As a tangible example, the Asia to North Europe trade had a capacity reduction of 29% compared to their announced schedules in the month of April. But what then happens in April 2021?
If the carriers deploy no additional capacity in 2021 but also blank no sailings, then in April we would see a 41% year-on-year increase in capacity – simply because the capacity offered in 2021 is now compared with the extremely low capacity offered in 2020. Or if the boom continues and the carriers inject 10% additional capacity, then the year-on-year capacity growth will become 55%.
We have the same problem in terms of demand. In April of 2020, total European imports declined 20% year-on-year. But this means that if European imports in 2021 simply revert back to the 2019 levels, this will show up in the statistics as a 25% demand growth. And if European import ends up having grown a modest 8% in total over the two years since 2019, this will show up in the 2021 statistics as a growth rate year-on-year of an astonishing 35%.
Hence the headline of this article: Don't be fooled by the statistics in the coming months emanating from the container shipping industry. The normal year-on-year growth rates for capacity and demand on both global and trade lane levels will seem extremely high. Not because they are high, but because of the mathematical problems in comparing to the pandemic- induced extremes of 2020.
When you see extremely high capacity injection, it does not in itself signal overcapacity. When you see extremely high demand growth, it does not in itself signal a major demand boom.
The good approach to assessing the underlying structural strength of the market is to also compare to 2019 and see to which extend the compounded 2-year growth rate appears well aligned or not.
About Lars Jensen, CEO, SeaIntelligence Consulting
Lars is a leading expert and thought leader in analyzing global container shipping markets. Lars has 19 years' experience hereof the last nine within multiple companies he has founded, with the main focus as CEO of Seaintelligence Consulting.
FBX Index: Current Market Summary
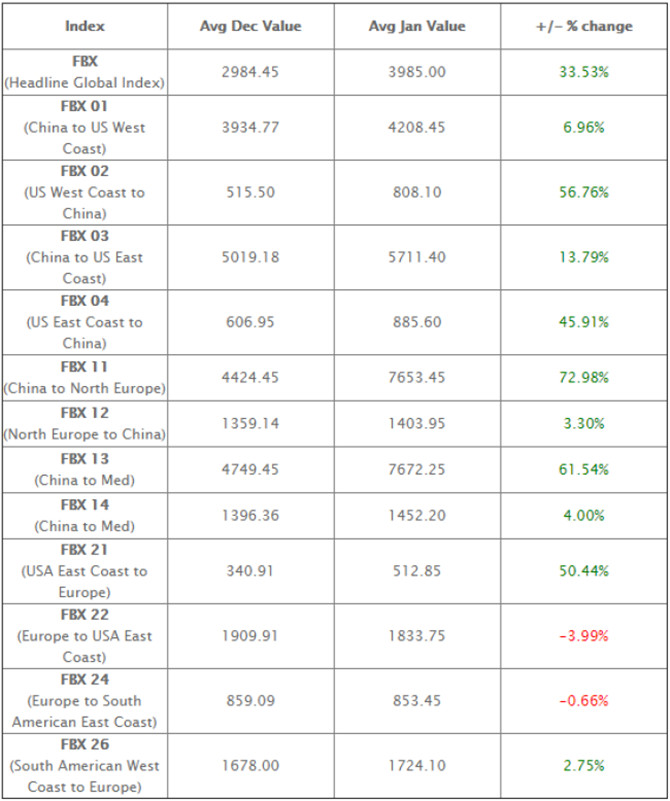
The Freightos Baltic Global Container Index (FBX) climbed 21% this month to an FBX-high of $4,077/FEU, a 162% increase annually.
With the pandemic still raging and consumers still spending on goods instead of services that require leaving the house, demand for ocean freight continued to surge through the normal post-holiday lull and straight toward Chinese New Year in February.
The persistence of peak level demand and volumes – especially in the form of containers arriving to the US West Coast from Asia – meant that January brought no relief to the port congestion, delays, and the resulting shortage of empty containers back at Asian origin ports that have plagued the industry since November.
Though ocean freight rates from Asia to the US increased only moderately this month, the bump – which actually started just before the end of the year – is of note as rates had stayed unmoved since mid-September after Chinese regulators intervened to slow the then spiking rates. Asia-US West
Coast rates increased 10% to $4,262/FEU and East Coast rates hit $5,651/FEU, up 15% since December 25th, though the West Coast rate is 180% higher than last year and East Coast is 93% more expensive.
And backhaul rates for US exporters to Asia continued to climb. US West Coast to Asia rates closed the month at $887/FEU, up 92% since the end of November, and East Coast prices hit $952/FEU, up 63% in the last two months, as carriers try to balance export demands with pressure to move empty containers.
Asia to North Europe and the Mediterranean. Asia-North Europe rates climbed to $7,830/FEU, up 38% on the month, and an incredible 288% compared to last year. Asia-Mediterranean prices increased 43% to $8,093/FEU, a 233% gain annually
The global container shortage also kept pushing prices up from Asia to North Europe and the Mediterranean. Asia-North Europe rates climbed to $7,830/FEU, up 38% on the month, and an incredible 288% compared to last year. Asia-Mediterranean prices increased 43% to $8,093/FEU, a 233% gain annually. Rates on both lanes have more than tripled in the course of three months.
And in response to the crisis, carriers have been stopping bookings, skipping port calls, or blanking sailings in attempts to recover schedules. So the delays, disruptions to schedules, and scarce equipment mean that actual costs to shippers to secure increasingly scarce space – if they can secure a booking at all – are thousands more in premiums and surcharges.
The backlog of volumes currently in demand and the current surge of the pandemic could keep demand high and equipment scarce well into the spring. This push would leave only a couple of months of possible downtime before this year's peak season uptick in July.
About Judah Levine, Research Lead, Freightos
Judah is an experienced market research manager, using data-driven analytics to deliver market-based insights. Judah produces the Freightos Group's FBX Weekly Freight Update and other research on what's happening in the industry from shipper behaviors to the latest in logistics technology and digitization.
FBX Index: Looking forward

The market has come a long way in a few months, shipper demands for capacity collided with liner demands for restraint mid-2020, have now peaked with anecdotally 'maxed out' capacity, and 2020 going down as one of the worst years in container liner history for contract reliability. In terms of forward pricing, Trans-Pacific mid-values have remained largely in line with upward correction since October 2020, with January spot rate growth of 9.69% on FBX01 a result of extreme congestion on the US West Coast. Buyers in the market have become more confident in pricing in a backdated 2021 forward curve, however interests remain highly diverse in both FFAs and physical shipments.
The opinions expressed herein are the author's and not necessarily those of The Xinde Marine News.
Please Contact Us at:
media@xindemarine.com


.gif)


 Ningbo Containerized Freight Index Weekly Commentar
  Ningbo Containerized Freight Index Weekly Commentar
  BIMCO Shipping Number of the Week: Bulker newbuildi
  Ningbo Containerized Freight Index Weekly Commentar
  Ningbo Containerized Freight Index Weekly Commentar