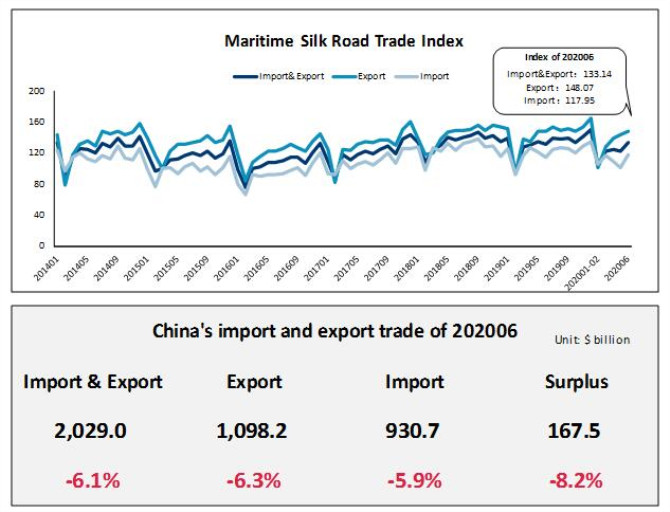
In June 2020, the Maritime Silk Road Trade Index (STI) released by the Ningbo Shipping Exchange showed that the import and export trade index was 133.14 points, up 8.56% from the previous month and up 1.61% year-on-year; the export trade index was 148.07 points, up 0.34% from the previous month , a year-on-year increase of 0.35%; the import trade index was 117.95 points, a increase of 16.17% month-on-month and a year-on-year increase of 3.27%.
From January to June, my country’s total import and export trade was 2,028.993 billion US dollars, a year-on-year decrease of 6.10%. Total export trade was US$1098.248 billion, down 6.26% year-on-year; total import trade was US$930.745 billion, down 5.92% year-on-year.
China’s trade with continents
From January to June, the import and export trade value between China and Asia was US$1,059.046 billion, a year-on-year decrease of 4.58%, accounting for 52.20% of China’s total import and export value. The export trade value was 535.941 billion US dollars, down 6.17% year-on-year; import trade value was 523.105 billion US dollars, down 2.89% year-on-year.
From January to June, the import and export trade value between China and Europe was US$395.853 billion, a year-on-year decrease of 5.45%, accounting for 19.51% of China’s total import and export value. The export trade value was 229.17 billion US dollars, down 2.46% year-on-year; the import trade value was 166.683 billion US dollars, down 9.27% year-on-year.
From January to June, the import and export trade value between China and Africa was US$82.511 billion, down 18.80% year-on-year, accounting for 4.07% of China’s total import and export value. The export trade value was 48.46 billion US dollars, down 8.30% year-on-year; the import trade value was 34.05 billion US dollars, down 30.17% year-on-year.
From January to June, the import and export trade value between China and North America was US$260.355 billion, a year-on-year decrease of 10.61%, accounting for 12.83% of China’s total import and export value. The export trade value was 193.834 billion US dollars, down 10.62% year-on-year; the import trade value was 66.521 billion US dollars, down 10.56% year-on-year.
From January to June, the import and export trade value between China and Latin America was US$139.063 billion, down 5.33% year-on-year, accounting for 6.85% of China’s total import and export value. The export trade value was 63.151 billion US dollars, down 8.69% year-on-year; the import trade value was 75.912 billion US dollars, down 2.35% year-on-year.
From January to June, the import and export trade value between China and Oceania was US$91.997 billion, a year-on-year decrease of 0.02%, accounting for 4.53% of China’s total import and export value. The export trade value was 27.69 billion U.S. dollars, a year-on-year increase of 4.00%; the import trade value was 64.306 billion U.S. dollars, a year-on-year decrease of 1.65%.
Source:Ningbo Shipping Exchange
The opinions expressed herein are the author's and not necessarily those of The Xinde Marine News.
Please Contact Us at:
media@xindemarine.com


.gif)


 Ningbo Containerized Freight Index Weekly Commentar
  Ningbo Containerized Freight Index Weekly Commentar
  BIMCO Shipping Number of the Week: Bulker newbuildi
  Ningbo Containerized Freight Index Weekly Commentar
  Ningbo Containerized Freight Index Weekly Commentar